In this step by step guide, we’ll walk through creating a CUCM CDR Call Analytics report that details the total (combined) and individual capacity utilization for 2 specific CUCM SIP Trunk devices.
Background
In Variphy, CDR-based capacity utilization is determined by identifying the number of concurrent calls in progress at every second in time within the applicable search time window, such as the current day or previous week.
While capacity utilization reporting is often desired for specific devices, such as SIP trunks, PRIs, or other gateways, it can be created for any set of call activity in Variphy, such as:
- between 2 particular office locations
- call centers
- inbound calls to help desk, support teams, or hotlines
How To Build A Capacity Report
From the Reports page in CUCM CDR Call Analytics, click the Create History Report option.

In the dialog window which opens…
In the Basics tab:
Enter a Name for the report will be used as the title – this is required.
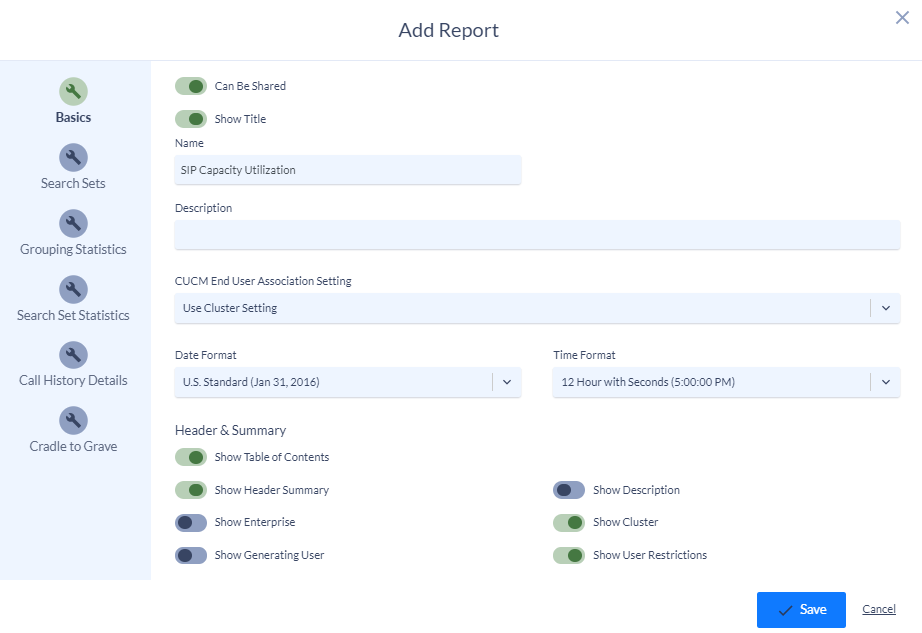
In the Search Sets tab:
Click the Create Search Set link to create a new set of search criteria.
At least 1 Search Set is required, as this defines what CUCM CDR data to base this report and the capacity utilization upon.
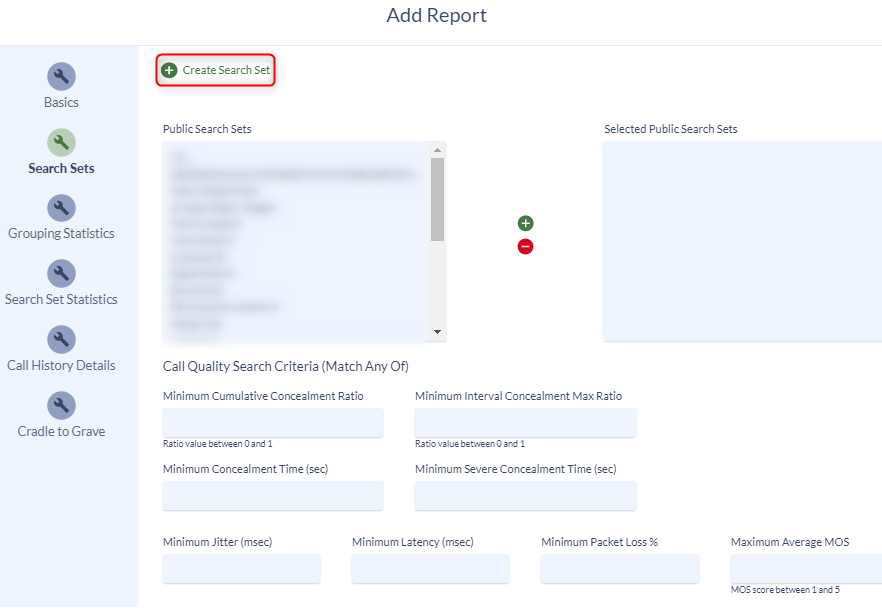
Let’s create a Search Set for our 2 SIP Trunks
Enter a Name, such as “SIP Trunks”
Search Criteria are search values for a specific type. In this example, our SIP Trunks can be identified by their CUCM device names.
Select Originating or Terminating Device Name in the Search Criteria field and then click the Add Criteria link in order to specify our device name search values.
By using Originating or Terminating Device Name, this report will show capacity utilization based upon both incoming and outgoing calls for the SIP trunks. If you prefer just incoming only or outgoing, then choose the appropriate type from the Search Criteria.
Hint: You can type into the field to quickly filter and find desired options, as there’s a lot to choose from!
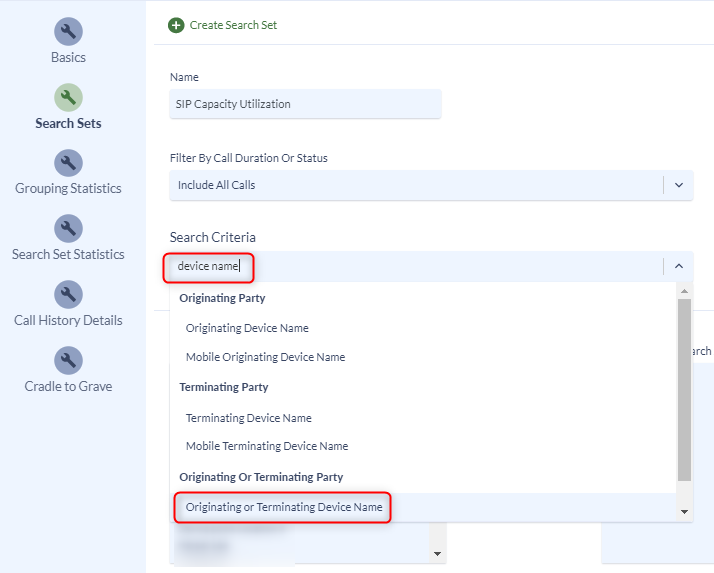
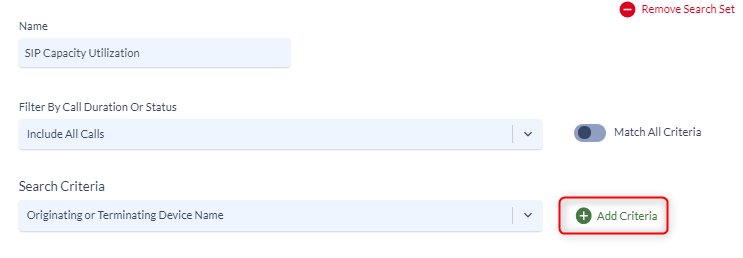
In the Originating or Terminating Device Name section, we’ll use the 2 CUCM device names of our SIP trunks, “sip-trunk-1” and “sip-trunk-2”.
Since we want these device names explicitly and exactly, we’ll use the equals conditional option for both.
After entering in the 1st device name, we can click the green plus icon to add a second value.

Once complete, we have both our Originating or Terminating Device Name criteria values.

In the Grouping Statistics Tab
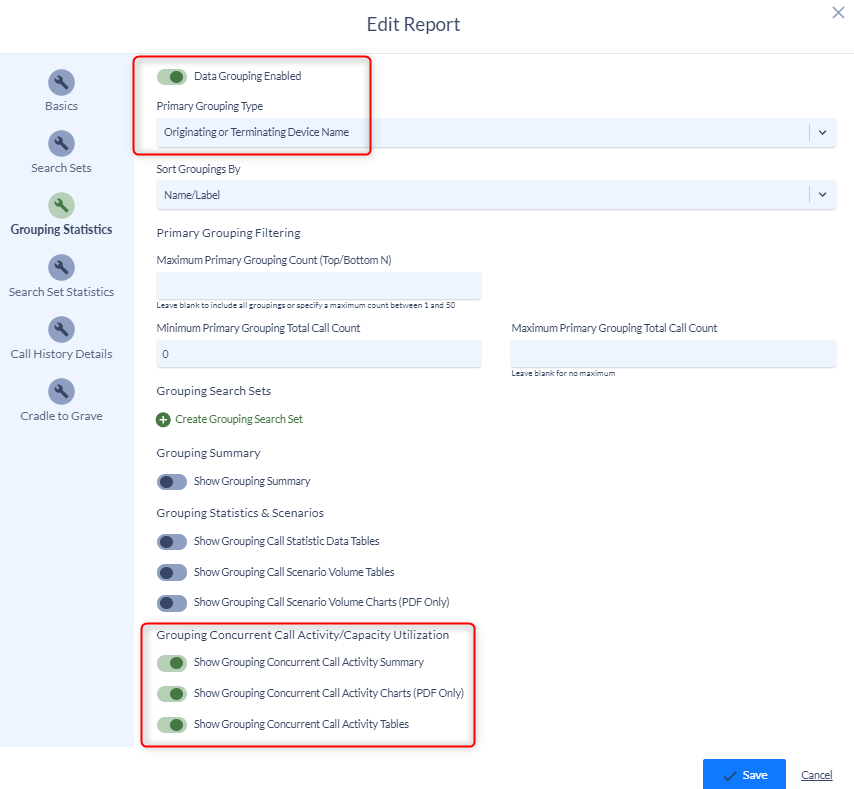
Enable the Data Grouping Enabled option. Since this report will compute and show capacity utilization per SIP trunk device, we want to enable data grouping.
Select Originating or Terminating Device Name as the Primary Grouping Type – this will configure this report to compute capacity analytics per SIP trunk device.
In the Grouping Concurrent Call Activity/Capacity Utilization section, enable the following options:
Show Grouping Concurrent Call Activity Summary
Enable this option for the report to include a summary of Concurrent Call Activity for each grouping (CUCM SIP trunk device in this example).
With this option enabled, the report will contain the following summary:

Show Grouping Concurrent Call Activity Chart (PDF Only)
Enable this option for the report to include time based concurrent call activity charts for each individual grouping (CUCM SIP trunk device in this example), with each day of the year plotted with its own line and color.
With this option enabled, the report will contain the following chart(s):

Show Grouping Concurrent Call Activity Table
Enable this option for the report to include a tabular breakdown of the total time duration and percentage of time (compared to total) for each number of Concurrent Calls that occurred, for each grouping (CUCM SIP trunk device in this example).
In this example, the CUCM SIP trunk device had a peak of 45 Concurrent Calls for only 1 second (00:00:01) in time.
With this option enabled, the report will contain the following summary:

With all of our desired settings, the Grouping Statistics tab will look like this:
In the Search Set Statistics Tab
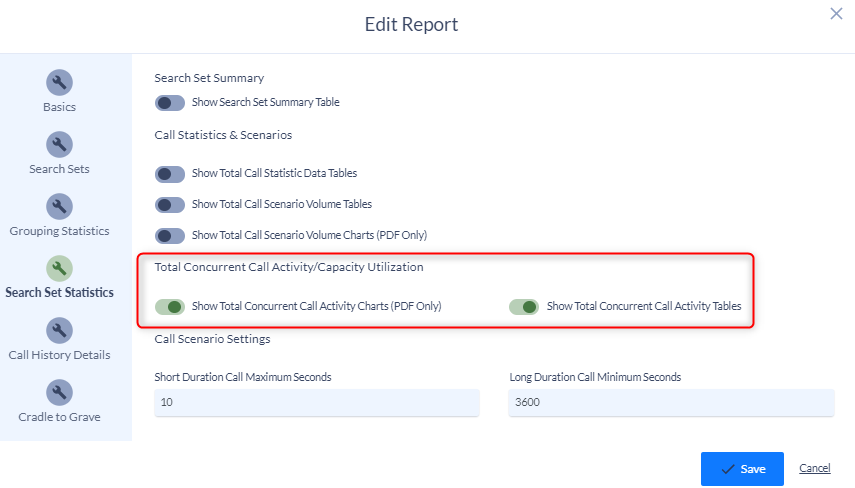
In the Total Concurrent Call Activity/Capacity Utilization section, enable the following options:
Show Total Concurrent Call Activity Chart (PDF Only)
Enable this option to include total time based concurrent call activity charts for all of the call activity which the report was generated for, with each day of the year plotted with its own line and color.
With this option enabled, the report will contain the following chart(s):

Show Total Concurrent Call Activity Table
Enable this option for the report to include a tabular breakdown of the total time duration and time window percentage (of the report’s total search time window) for all of the call activity which the report was generated for.
In this example, the total peak of 97 Concurrent Calls occurred for only 5 seconds (00:00:05) in time.
With this option enabled, the report will contain the following table:

In The Call History Details Tab
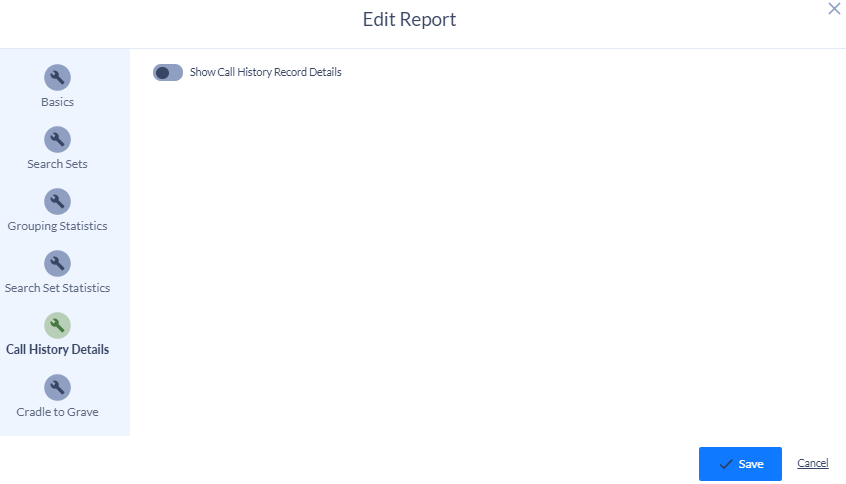
Disable the Show Call History Details option. This will exclude the details for each CUCM CDR record for which the report is based upon, which would make the report quite long in this example since we are reporting on all SIP trunk call activity.
In The Cradle to Grave Tab
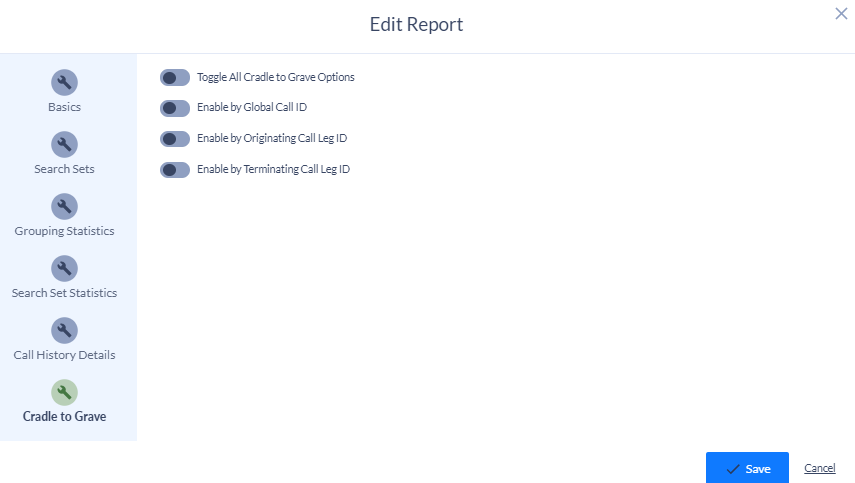
Disable all Cradle to Grave options.
When finished, click the Save button to save the report.
If you have any further questions, or would like assistance with configuring Variphy Capacity Utilization Reports, please contact us at support@variphy.com and a support ticket will automatically be added to our queue. One of or software engineers will reach out to schedule a support session with you as soon as possible. Please note that our normal support hours are M-F from 7:00-4:00 Pacific Time, excluding U.S. Holidays.