Variphy 12.0 is our most ambitious and anticipated release to date.
We’ve added a new feature, UCCX Call Analytics Reporting, overhauled our Dashboard system, modernized the entire user interface, and more.
Upgrading Variphy
You can upgrade your existing version of Variphy directly to version 12.
After upgrading, you’ll notice a number of improvements and differences, including:
The UI has been updated with a new color scheme and better use of space and browser resolutions. We hope you like it too!
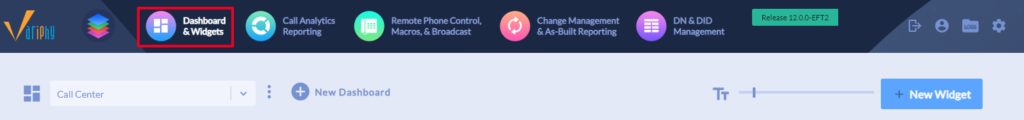
There’s no more Navigation panel on the left – it’s now all in the top header. See the “App Launcher” section below for more details.
If you have the Call Analytics feature licensed, you’ll now also see a “Dashboard & Widgets” icon in the main navigation. In version 12, we made the Dashboard a standalone feature. See the “Dashboards & Widgets” section below for more details.
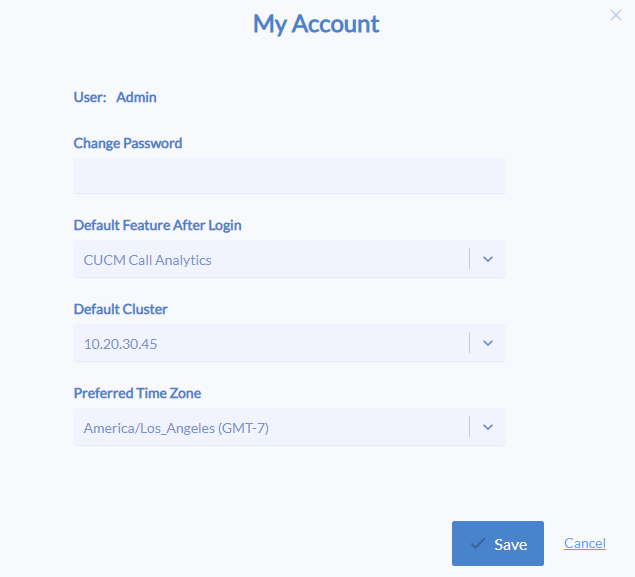
After logging in, you’ll be automatically redirected to your “Default Feature”, which is new, configurable (via My Account) option in this version for each user account. See the “Default Feature Navigation” section below for more details.
UCCX Call Analytics Reporting
What’s easily the most anticipated improvement in this release, we’ve expanded our Call Analytics Reporting to specifically support Cisco UCCX 8.5 – 12.0.
Our UCCX Call Analytics Reporting provides 2 types of reports, which can be run/downloaded on demand or emailed/scheduled for delivery:
Agent Productivity, State Statistics & Call Details
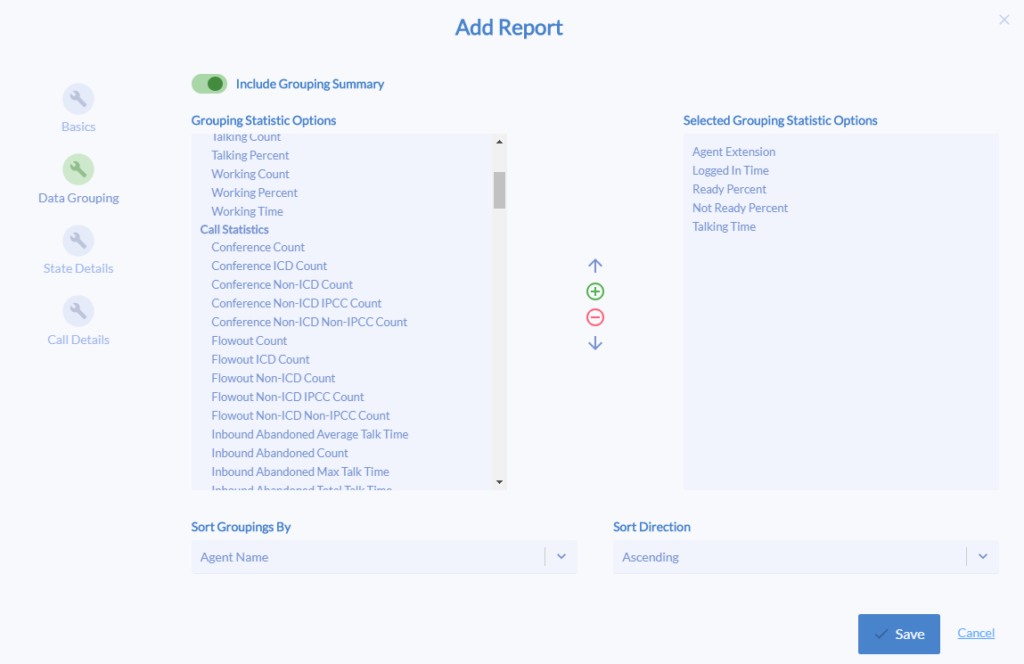
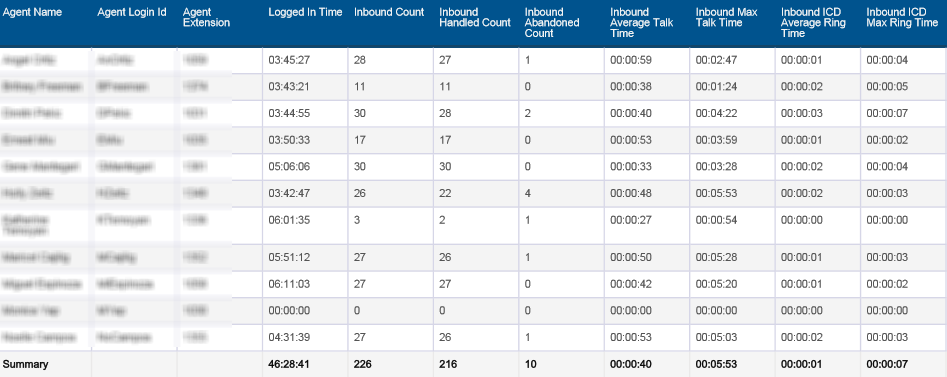
Our highly configurable Agent-focused reporting can include state statistics, such as the total number of occurrences and duration each Agent is spending in Not Ready States, as well as call statistics such as the number of call handled, abandoned, etc.
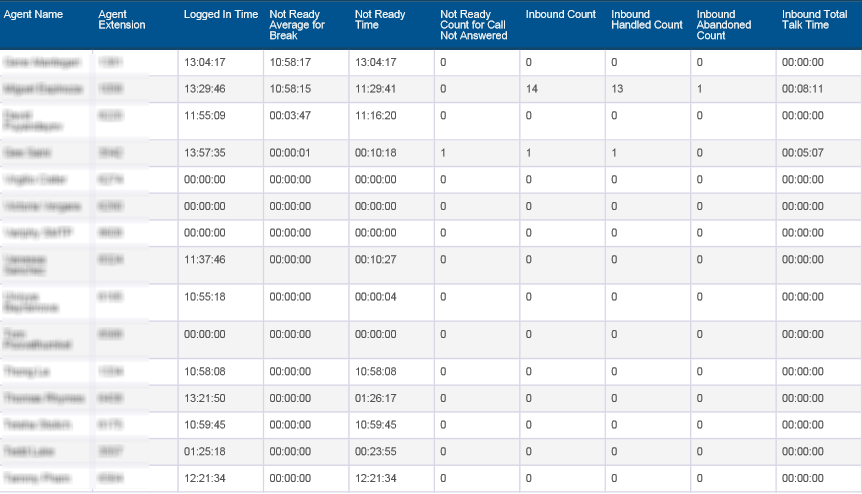
There are over 100 productivity or stat metrics to select from to include in a report, including full support for Custom Reason Codes (Finesse required).
Contact Service Queue (CSQ)
For 1, some specific, or all CSQs, you easily customize and produce statistical reports showing your desired KPIs, including counts, percentages, and service level metrics.
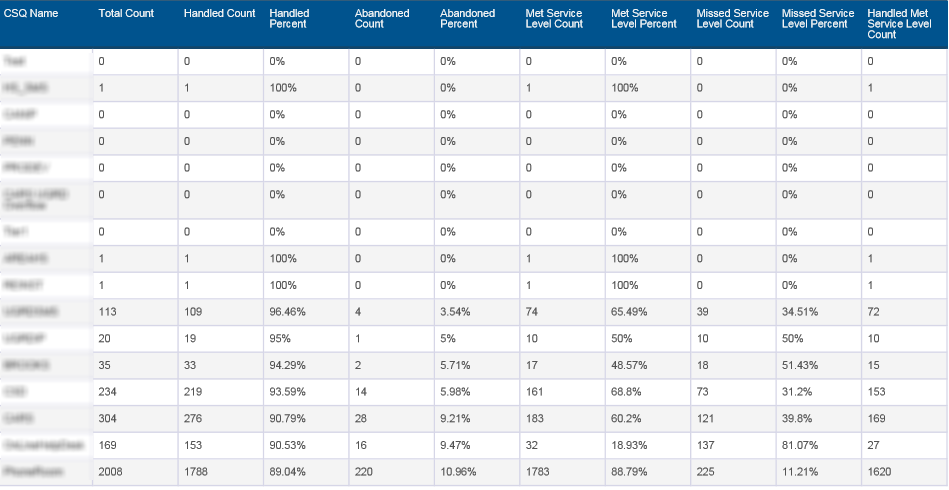
Just like our CUCM CDR Call Analytics, UCCX reports can be generated in PDF, HTML, XLSX, or CSV and scheduled for regular/automated delivery via email or FTP (as well as on-demand). When generated a report, choose from dozens of time window (such as “Current Day”, “Current Week”, “Previous Month”, etc).
Dashboards & Widgets
Standalone & Accessible From Main Navigation
Dashboards are no longer embedded in CUCM CDR Call Analytics. To use your Dashboards, simply select it from the main navigation – it’ll appear as the 1st option, if available.
Multiple Dashboard Management
Each user can now have multiple Dashboards – simply select the desired one to view from the list and use the New Dashboard button to create new ones.
Each Dashboard should have a unique name (among those owned by the same user).

Support For Multiple CUCM/UCCX Clusters
Each Dashboard can contain multiple widgets, each for different CUCM or UCCX Clusters.
For multi-clustered call control environments, if desired, a single Dashboard can now contain widgets that display CDR/Call Analytics data from different CUCM Clusters – a major upgrade from the previous version.
Layout Changes
We’ve overhauled the Dashboard layout system, to make better use of the different screen resolutions. As a result, after upgrading, you may notice that some of your widgets may appear to be slightly different in size/dimension.
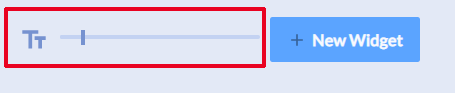
Font Size Scaling
To deliver on one of the most requested improvements from version 11, we’ve added the ability to adjust the size of the text content that appears in Widgets from much smaller to much, much larger to make it easier to view from distances and/or on shared monitors/displays.
User Permissions
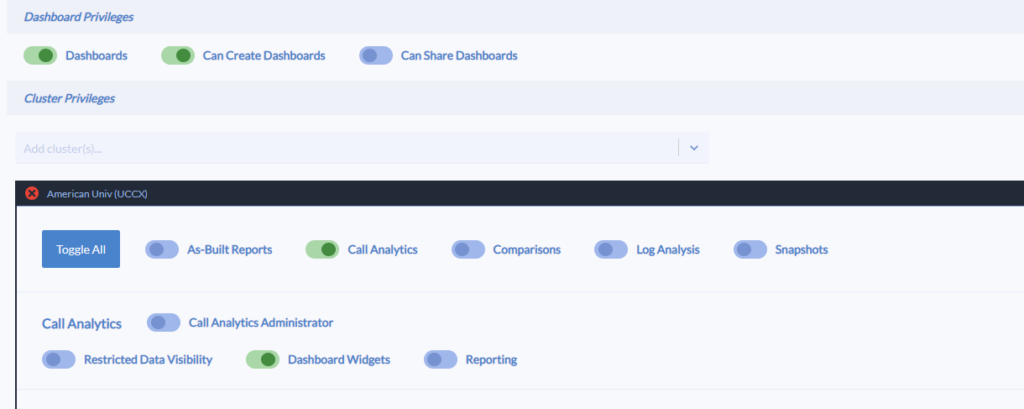
Each User Account or Group in Variphy can now be given permission to use (or not use) the Dashboard feature, along with which specific he/she can use/create Widgets for.
To provision Dashboard privileges, ensure the User/Account has the “Dashboards” option enabled within the “Dashboard Privileges” section and also has the “Dashboard Widgets” option enabled for at least 1 CUCM/UCCX Cluster.
CUCM CDR Call Analytics Reporting
Still easily our most popular feature, we always look to improve our CUCM CDR Call Analytics.
Capacity & Quality Integrated into History
Searching/exporting Call History data can now include capacity (when exporting/generating reports) and/or quality (detail columns) data if desired. To simplify things, we’ve done away with the explicit “Capacity” and “Quality” pages which existed in version 11.
Searching History With Multiple Criteria
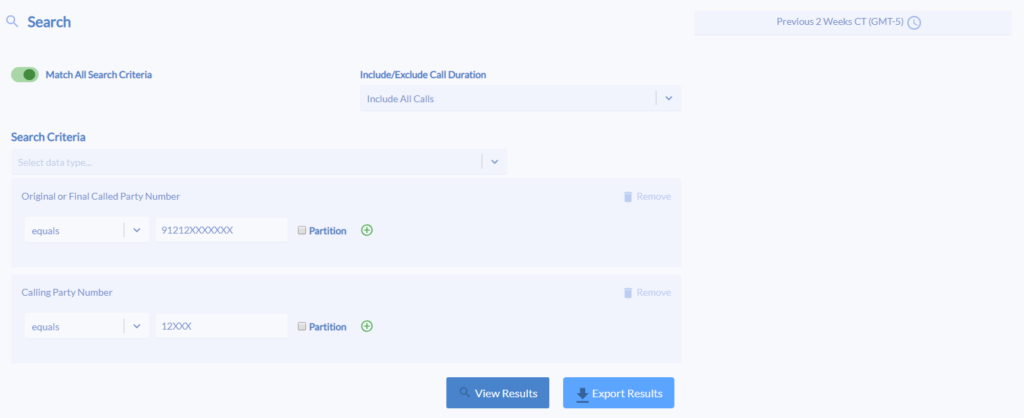
When searching or exporting Call History data in the UI, you can now use much more complex search criteria if needed. Specify multiple criteria types and values and choose whether to Match Any vs All (think “OR” vs “AND” respectively) and apply the appropriate Search Time Window in the upper right (“Previous 2 Weeks” in this example).
Always Visible Toolbar
In the upper right within Call Analytics, this new toolbar is always visible, making it easier to run a report from any page as well as to view what CDR is available to you (per the configuration, perhaps the system is only retaining the most recent 6 months of data), by clicking the Data Summary button.

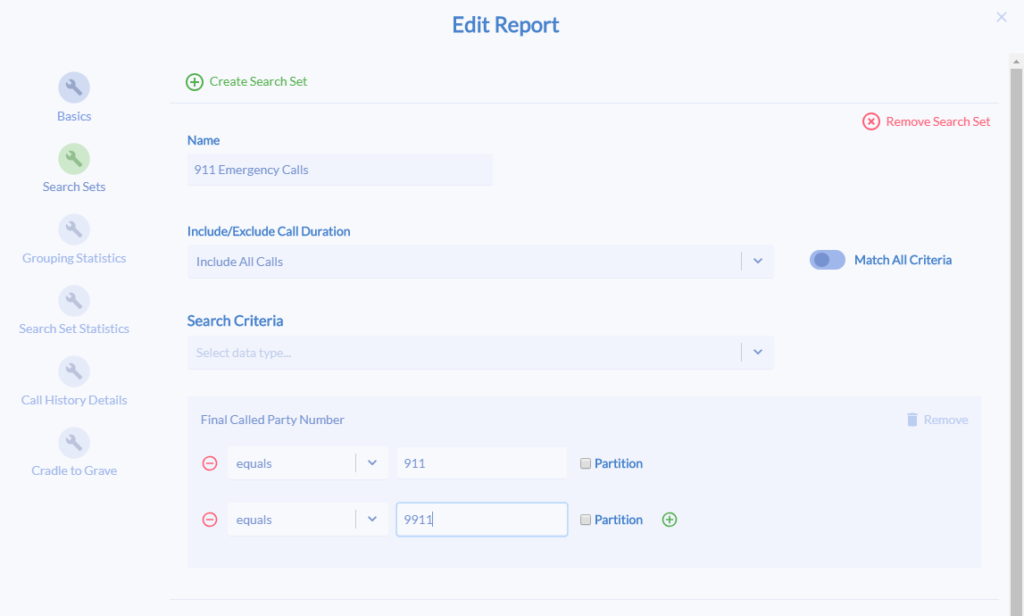
Modernized & Consistent Report Configuration Dialog
Our new/improved Search Set & Criteria user interface is now used everywhere it can be – searching Call History, Report configurations, Dashboard Widget configurations, and even CDR Alert configurations.
This now always make it much easier to add, remove, & modify search criteria.
Single Report Type
After upgrading, you’ll notice that there’s only 1 single type of CUCM CDR Call Analytics report now. The previously existing Capacity and Quality report types are now no different than any other type of report.
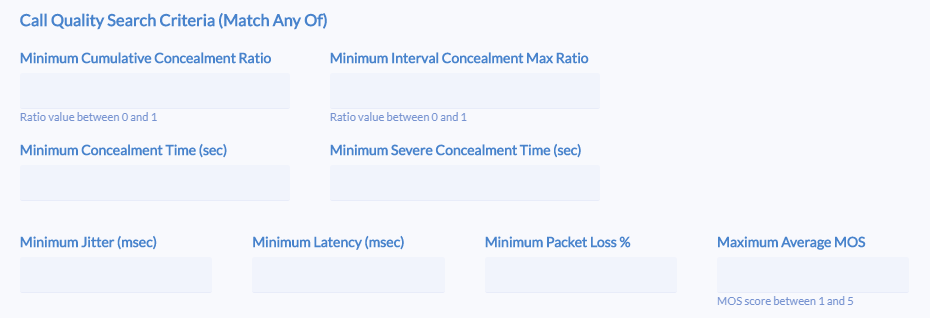
Quality Searches in Reports Now Includes Loss Concealment
To keep up with industry times, concealment ratios and time duration can now be used as optional additional call quality search criteria (applied in conjunction with the Report’s Search Set Criteria), in addition the legacy jitter, latency, packet loss, and average MOS scores.
Same Capacity Output Via New Options
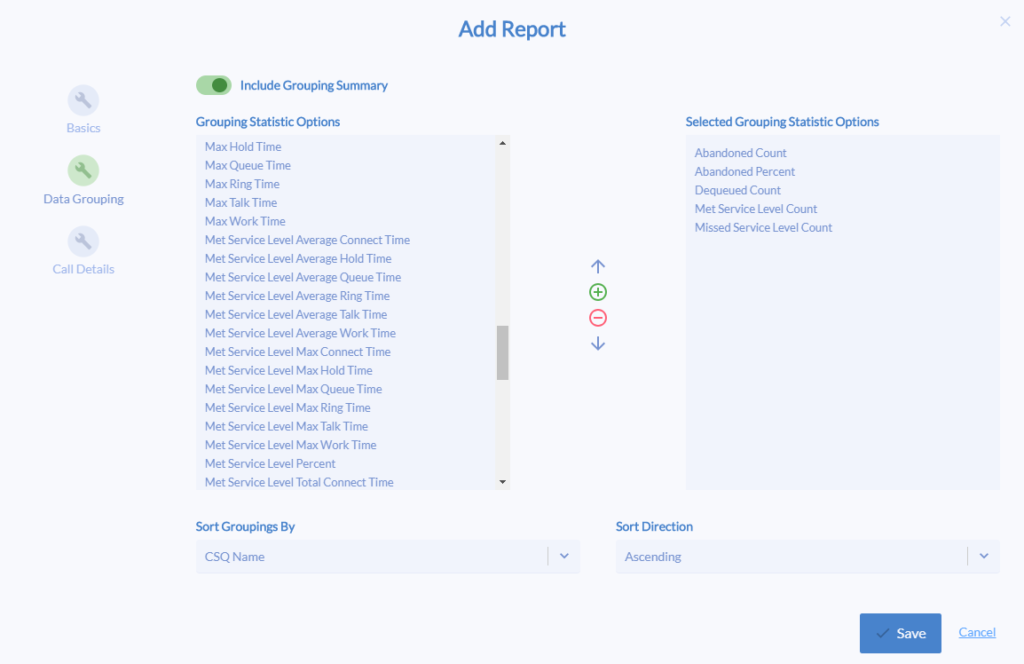
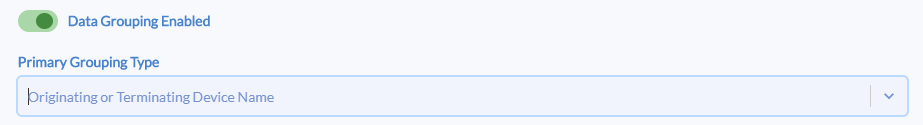
The capacity reports in previous versions are now simply standard reports in version 12, with the Data Grouping enabled, for the Originating or Terminating Device Name. This enables capacity/concurrent call activity analytics to be computed as a whole, as well as per desired device, such as SIP trunks or gateways.
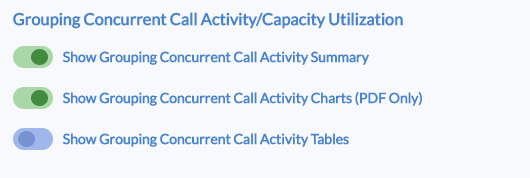
With the Data Grouping enabled, these options (in the Grouping Statistics tab) provide the ability to produce the same capacity output options as in previous versions for each Device (or other grouping). These will be automatically enabled as necessary as part of the upgrade for each existing Capacity report.
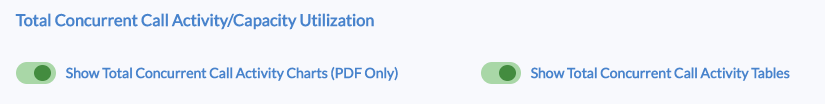
These options (in the Search Set Statistics tab) provide the ability to produce the same “total” capacity output options as in previous versions for all the calls for which the report is based upon (results for the Search Set Criteria) These will be automatically enabled as necessary as part of the upgrade for each existing Capacity report.
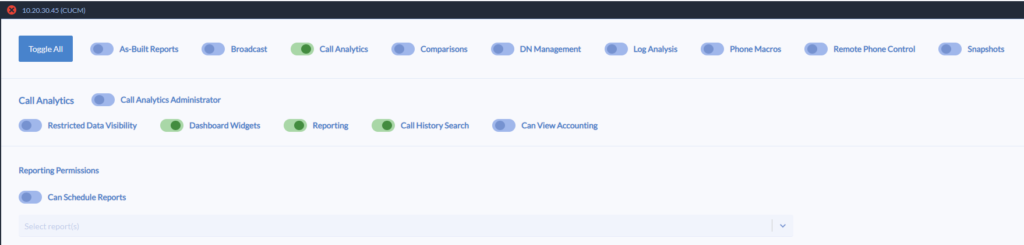
Enhanced User Privileges
Users can now be granted (or not granted) the ability to use CUCM CDR Widgets, Reporting, and/or Call History Searches for a CUCM Cluster in the Call Analytics feature.
App Launcher
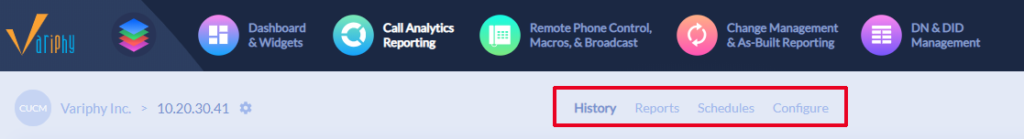
The “main navigation” will now appear at the top of all pages. Licensed features which the user has privileges for will appear in groups. We redesigned this navigation flow to simplify the selection and navigation process for our users with many clusters (10+) but also new users as well.
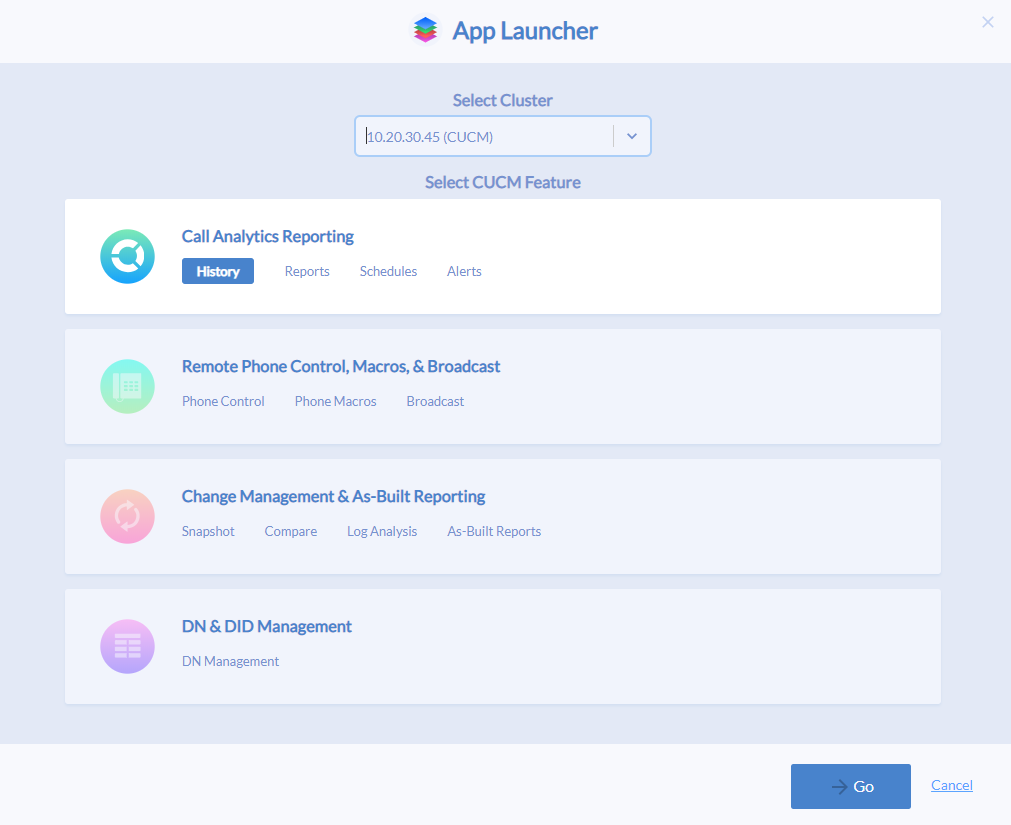
Regardless of which features are licensed/accessible to each user, the new “App Launcher” will always appear next to the Variphy logo.

Upon clicking the App Launcher icon, the following dialog will appear. To navigate/jump to a specific feature withing the application, you simply select the Cluster and then click the feature/page.
Default Feature Navigation
Each user can configure his/her own Default Feature After Login and corresponding Default Cluster (if applicable). Upon successful login, the user will automatically see his/her preferred page.