CSQ based report designed to provide Call Center Managers a high level overview of Total combined CSQ productivity and graphical trending month over month, Day over Day and Hour over Hour .
This report normally contains all CSQ’s for the Call Center but may be limited to specific CSQ’s. Commonly run quarterly to track volume trends and validate organizational or procedural changes are impacting Service Levels, Abandonment rates and Queue Times of all CSQ’s.
Required Changes
Because the report does not automatically know your CSQ’s you will need to add CSQ’s to the report.
- Edit the report.
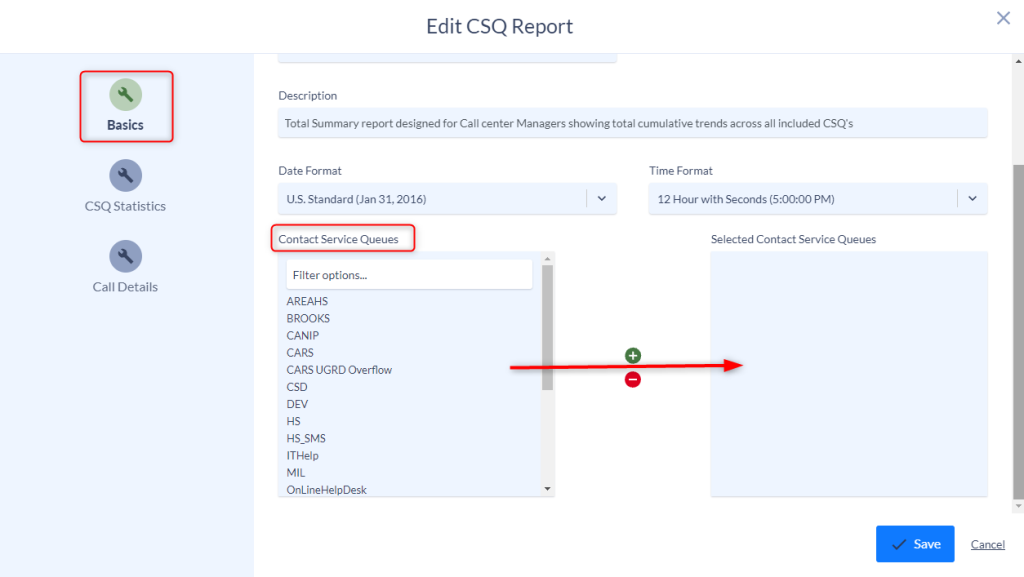
- On the Basic page scroll down to the “Contact Service Queues”
- Highlight the first CSQ in the list, scroll down to the last CSQ in the list and hold the SHIFT key on your keyboard and highly the last CSQ.
- Click the + sign to move all of the selected CSQs into the “Select Contact Center Queues” list.
- Optionally if you do not wish to include all CSQ’s only move the ones you wish to report.
- Save and then run your report
Optional Changes
The report is designed with standard summary values. You can add or remove summary values, change the order of the Summary Sections and adjust sorting by editing the report and navigating to the CSQ Statistics menu.
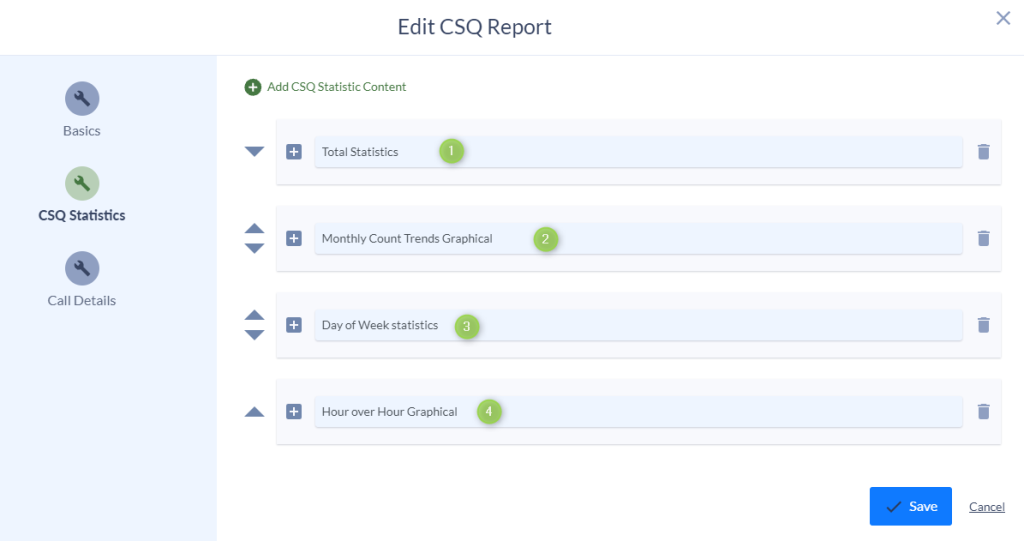
Clicking the Up/Down triangles next to each Summary Section will allow you to move the different sections of the report up or down.
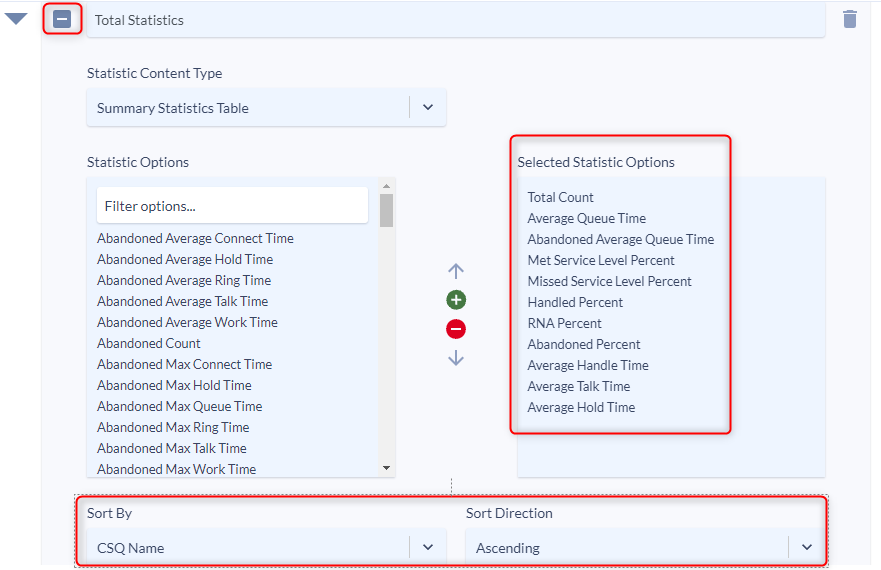
Clicking the + symbol next to the Summary Section will expand the summary menu showing the criteria added into that Summary Section of the report.
Once expanded you can add or remove additional summary values and change the order in which the report is sorted.
To add additional Summary Sections into the report click the “Add CSQ Statistic Content” at the top of the page.

Additional information on add new content can be found under the Variphy UCCX Call Analytics Reporting Guide.