This report will show the number of calls coming into one or more call queues. It will also display the number of answered, not connected and queued calls with a few additional statistics. Also included in the output will be a graphical summarization by hour for each call queue.
Commonly run daily to monitor staffing levels or to monitor call volume. This report can tell the user if more agents need to be added or if there are too many agents in a call queue. The charts can help identify the busy hour for each call queue.
Required Changes
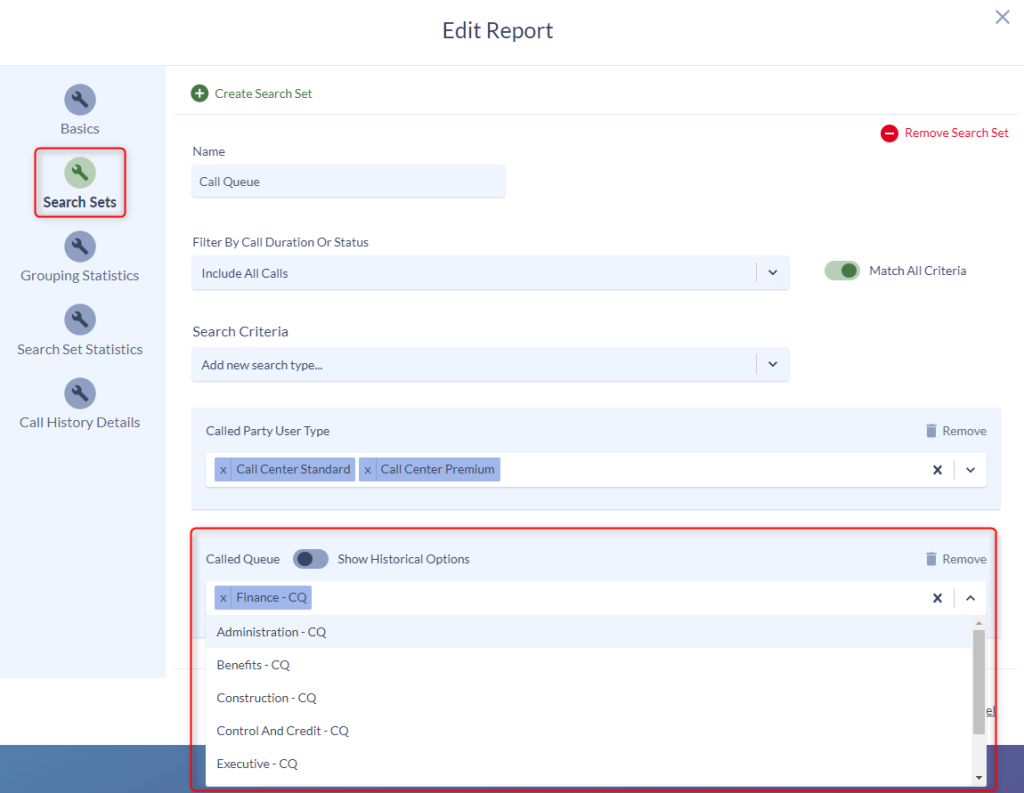
The report will need to be modified to show your particular call queue(s) by editing the report and clicking on Search Sets. Change the call queue name in the Called Queue field to reflect the desired call queue and add additional call queues if needed by selecting them from the list.
Optional Changes
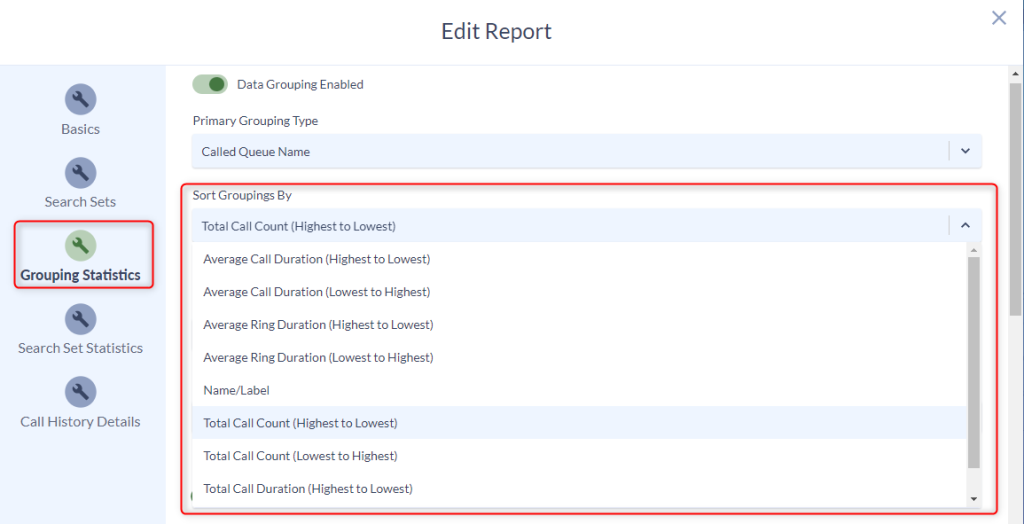
The sort order of the Called Queue Summary table can be modified by selecting a different option in the Sort Grouping By dropdown list in the Grouping Statistics menu.
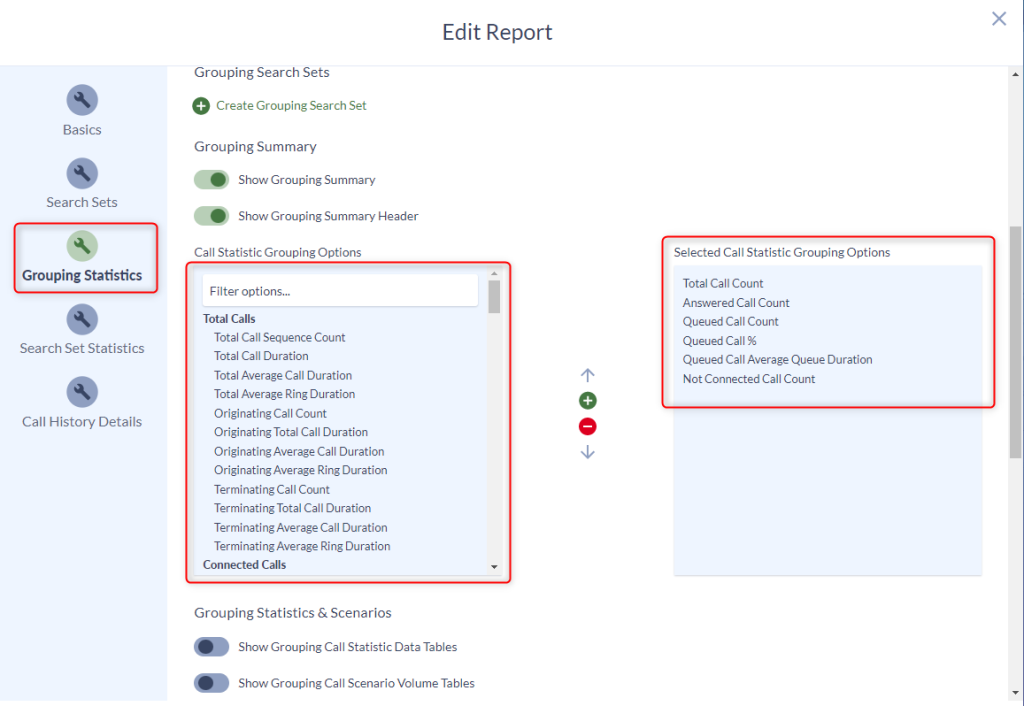
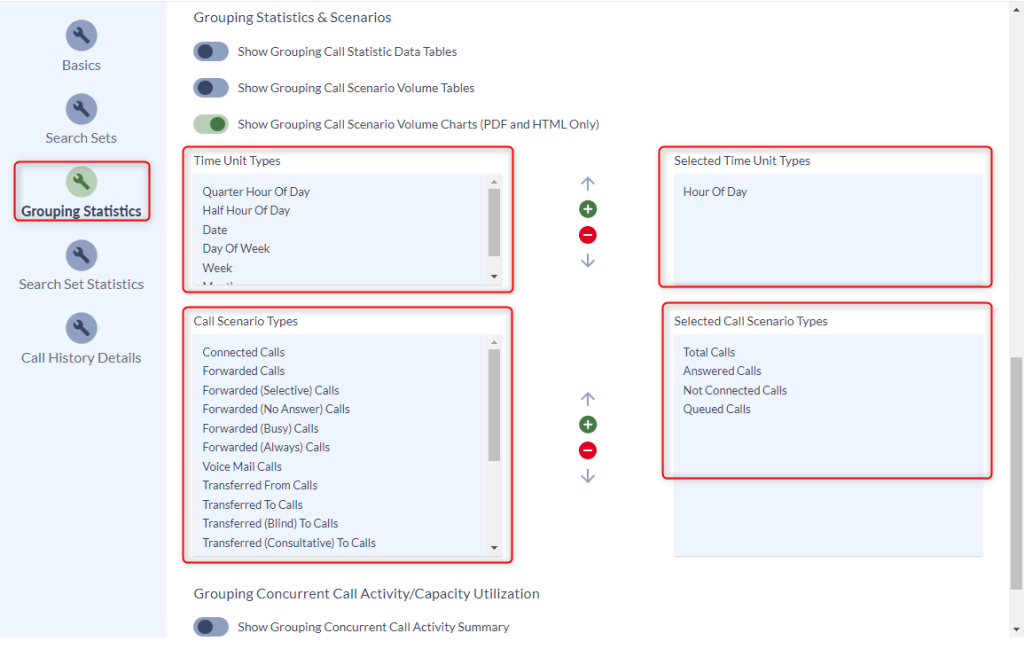
f you scroll down a little bit further in the Grouping Statistics menu you can modify the Selected Call Statistic Grouping Options. These are the statistics shown in the first table. You can also modify the time unit or call scenarios displayed in the charts. These values are configured in the section below the Selected Call Statistic Grouping Options.
To add more statistics you can click on the desired stat and then click the + icon. To remove a selected statistic, highlight it in the right box and click the – icon.