Applies to:
- Microsoft Teams users
- Microsoft Teams administrators
Introduction
Variphy Reporting and Analytics for Microsoft Teams Phone isn’t based on anything “canned” out of the box. Because every environment can be a bit different, Variphy’s solution is completely customizable, allowing reports to be configured for particular dial plans and deployments, along with the desired output content.
Because different users require different data, reports can be tailored to produce simple, high-level information like summary metrics only or include granular details like Caller ID, Extensions, Users, and Devices.
- Basic Report Concepts
- Summary, Statistics, and Detail Content (“Output”)
- Basics Tab
- Search Sets (“Input”)
- Search Set Statistics
- Grouping Statistics Summary and Analytics
- Call History Details
Basic Report Concepts
Each report configuration is based on the call data being searched (the “input”) and the result that is computed and displayed (the “output”).
A report configuration is not tied to a particular search time window or document output format (PDF, XLSX, HTML, and CSV). This means that the same report can be used to create other reports for different document output formats or different periods of time.
When generating a report, the search time window (e.g., “Yesterday” or “May 1 – May 4, 2022”) and document output format is also chosen, which together are all used to produce the desired output.
Summary, Statistics, and Detail Content (“Output”)
All possible content a report contains is based on the search set and can be enabled (and configured) or disabled according to the type of report to generate.
Variphy’s call history report output consists of the following possible sections. If all are enabled or applicable, these sections will appear in this order in the report:

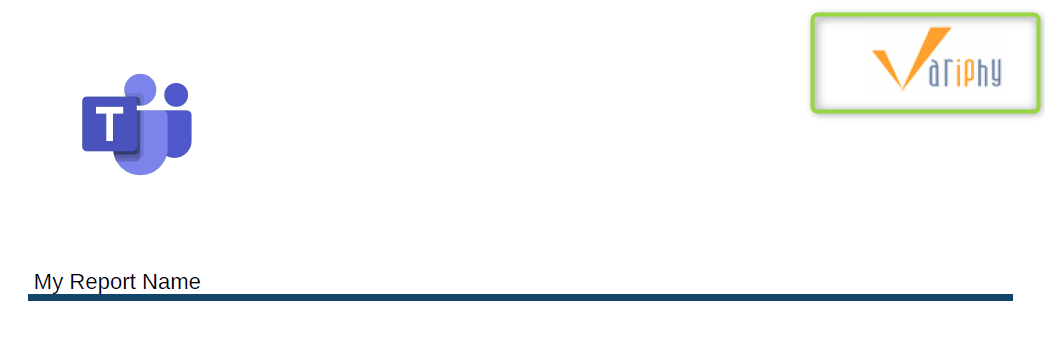
The default system logo is the Variphy logo.
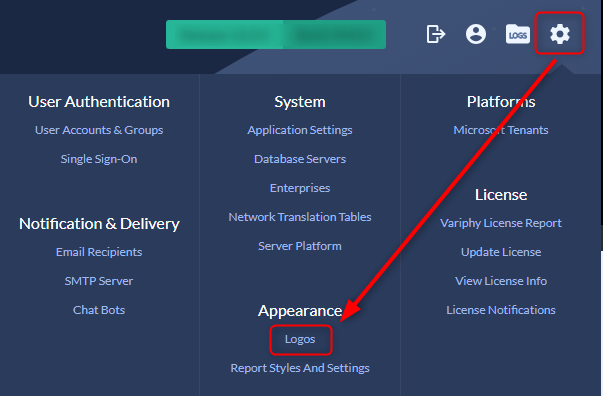
It can be replaced by Variphy administrators via the Logos option in the setup menu at the top right corner of the web interface.
The application system logo will be shown in the upper right of every page in the report for image-supported document types (PDF).
With the aspect ratio preserved, the width of the system logo in the report will be automatically decreased to 120 pixels.
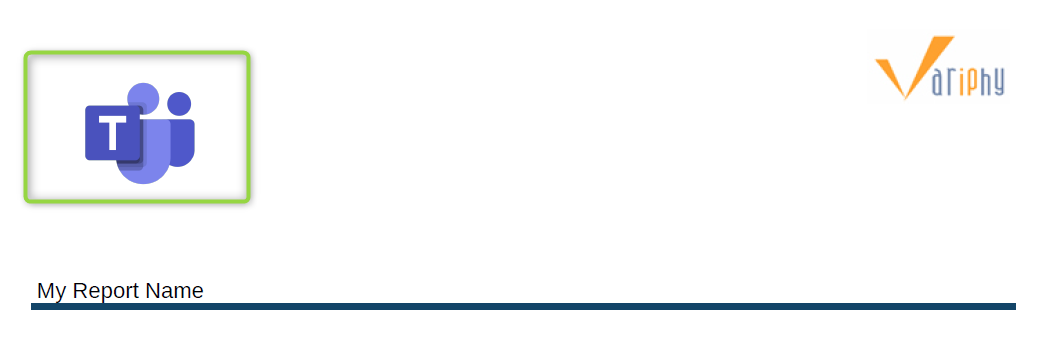
If configured, the logo for the corresponding calling platform will be included in the upper left of the report for image-supported document types (PDF). Platform logos can be specified by Variphy administrators via the Logos option in the setup menu at the top right corner of the interface.

With the aspect ratio preserved, the width of the cluster logo in the report will be automatically decreased to 120 pixels.
Basics Tab
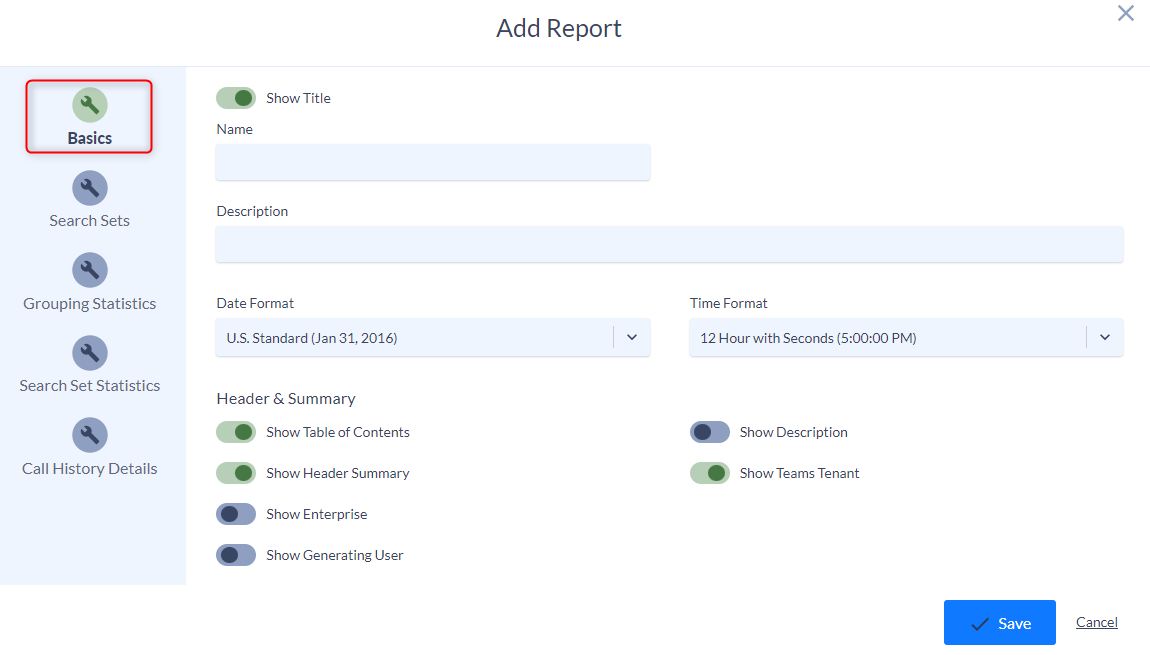
Report Title
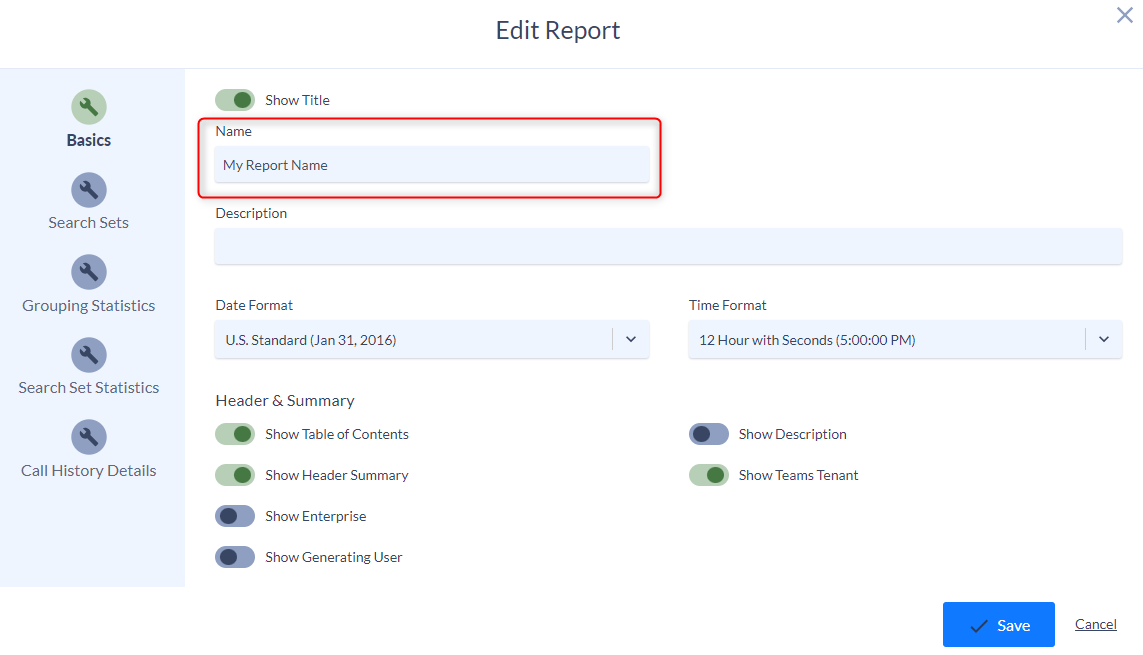
The report name (as configured in Variphy) will be used for the title in the output. The name can be configured in Variphy when adding or editing any report and can contain up to 255 characters.
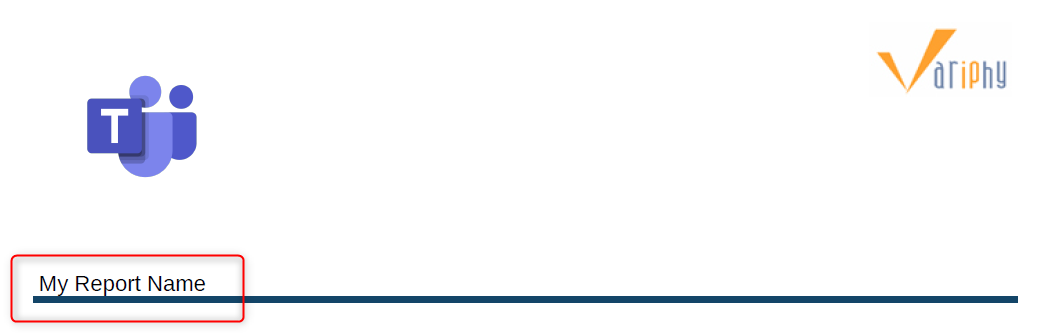
The title can be updated in the Name field in the Basics tab.
To exclude the title from a report, simply uncheck the Show Title option in the report configuration.
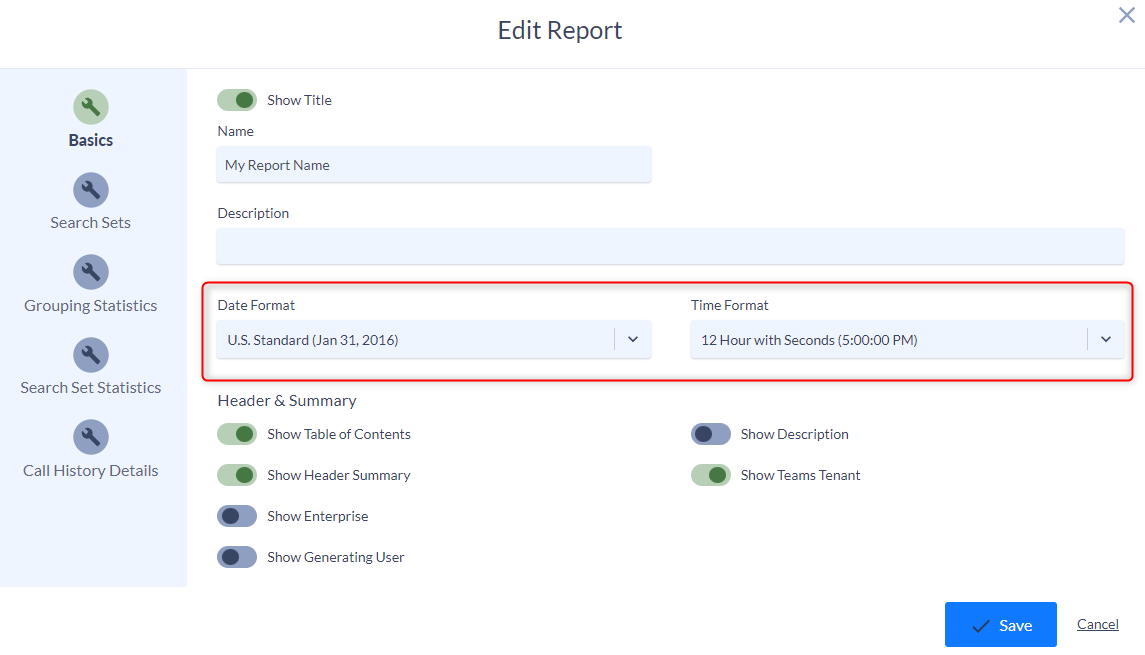
Date Format and Time Format
Choose the preferred date and time format, ranging from popular U.S. and international options.
Header and Summary
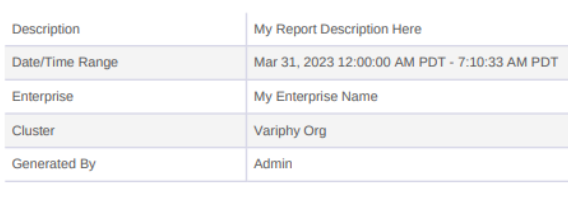
If enabled, the summary in a report can contain any of the following. The entire summary can be enabled or disabled by toggling the Show Header Summary option.
- Description: Up to 500 characters. To enable or disable this from the summary, toggle the Show Description option.
- Date/Time Range: Window of time for which the report was generated. If the Show Header Summary field is enabled, this will be shown automatically.
- Enterprise: The name of the Enterprise to which the reported cluster is assigned. To enable or disable this from the summary, toggle the Show Enterprise option.
- Cluster: The name of the cluster for which the report was generated. To enable or disable this from the summary, toggle the Show Cluster option.
- Generated By: The username of the user who generated the report. To enable or disable this from the summary, toggle the Show Generating User option.
- User Restrictions: If the report was generated by a user with data visibility restrictions (where the user is not configured with the ability to see all CDR data for the cluster) “(Limited)” will be displayed next to the cluster name. To enable or disable this from the summary, toggle the Show User Restrictions option.
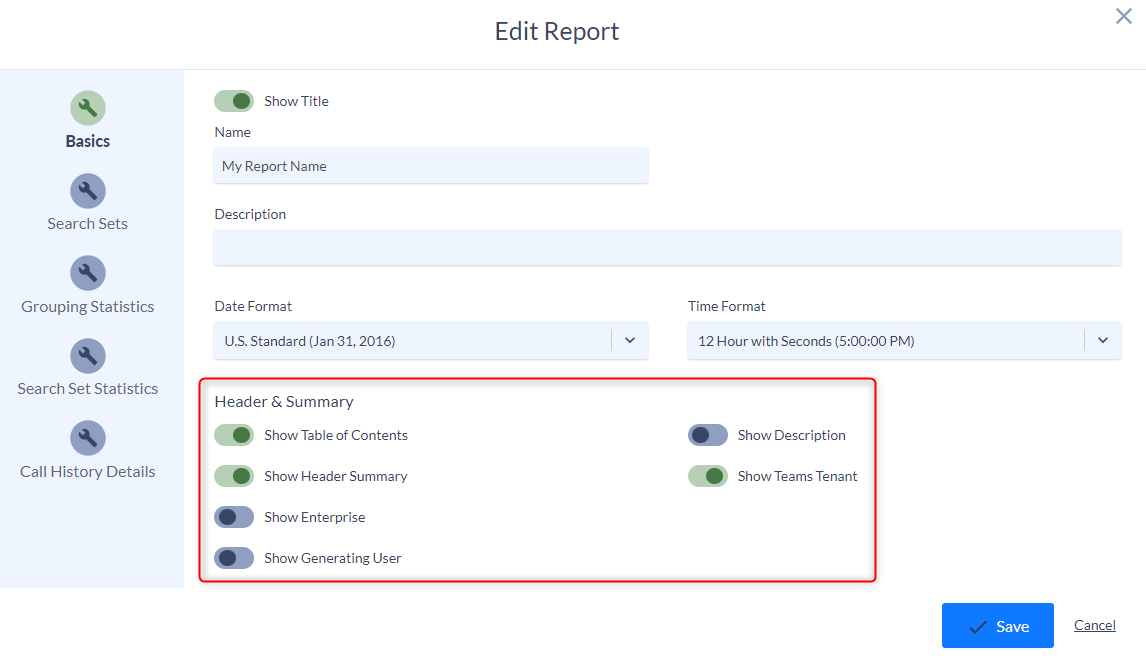
Table of Contents
The Table of Contents section contains content hyperlinks to navigate to a particular section in the report.
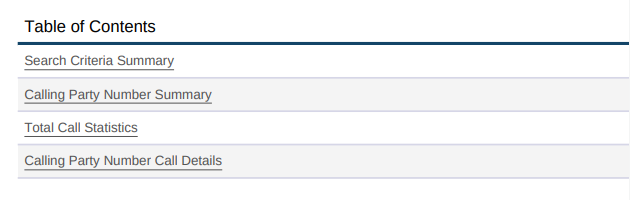
To enable or disable the Table of Contents from appearing in the report, toggle the Show Table of Contents option in the Header & Summary section on the Basics tab.
Search Sets (“Input”)
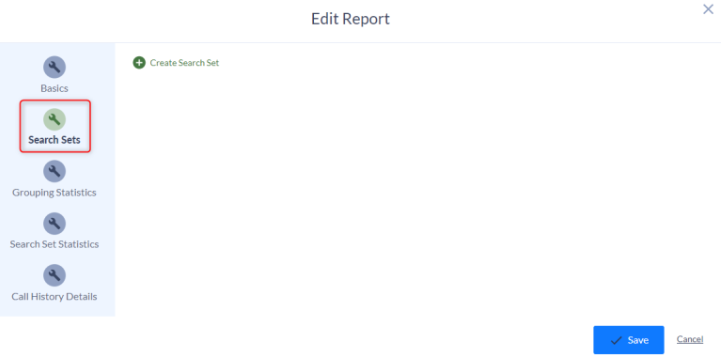
Each report is based on a search set that identifies the desired call activity, such as:
- All calls to 911
- To or from all end users in the Technical Support department
- To the Variphy team
- Originating or terminating from users Dan or Edgar
Each report must contain at least one search set, which, in turn, must contain at least one search criterion. A single search set (with one or more criteria) is often all that is needed, but in some cases, multiple search sets may be required to pinpoint a specific set of call activity.
The Search Sets tab contains the report’s configuration for search set criteria. For each of the examples above, the search sets might look like the following:
1. All calls to 911
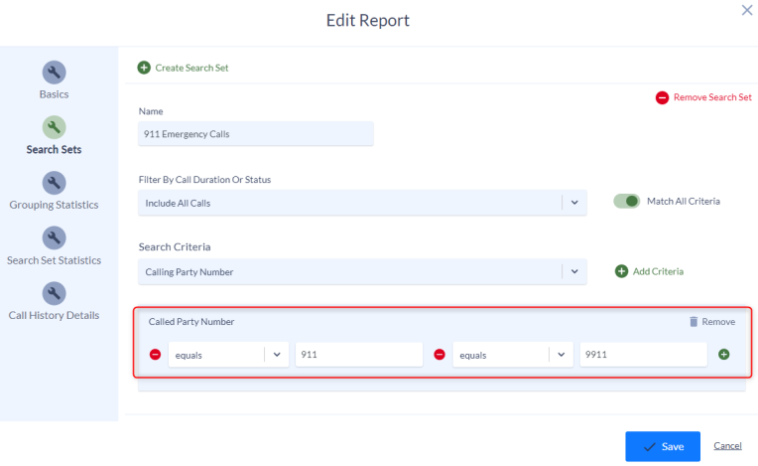
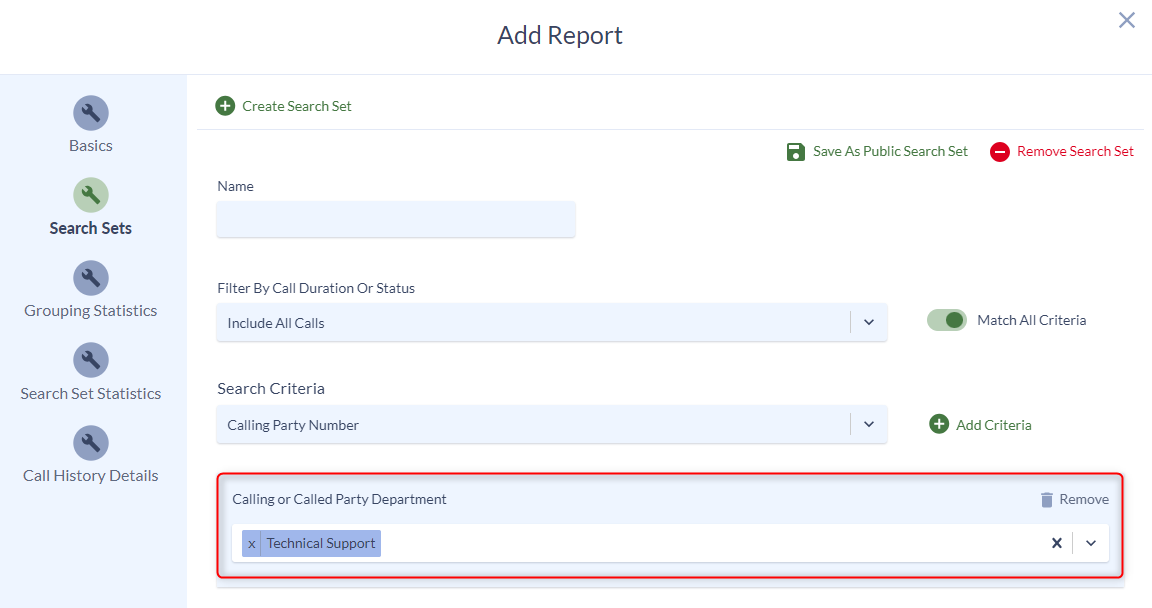
2. To or from all users in the Technical Support department
User-based search sets like Calling Party/Called Party User or Calling or Called Party Department allow for querying of historical user information. Toggling on the Show Historical Options allows you to search on user-based information no longer existing in your Teams hierarchy.
For example, if a user is no longer with the company but you wish to search their name, you can toggle on Show Historical Options and select the user from the pick list. Historical entities will appear with a small flag next to their respective criteria, indicating it is a historical entity.
3. To the Variphy Team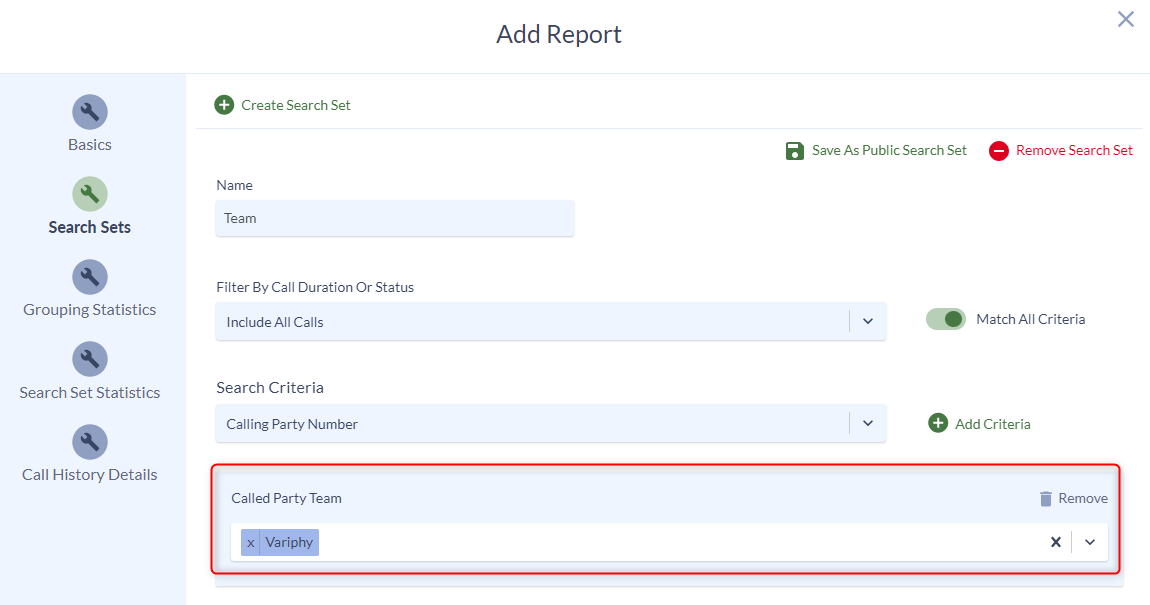
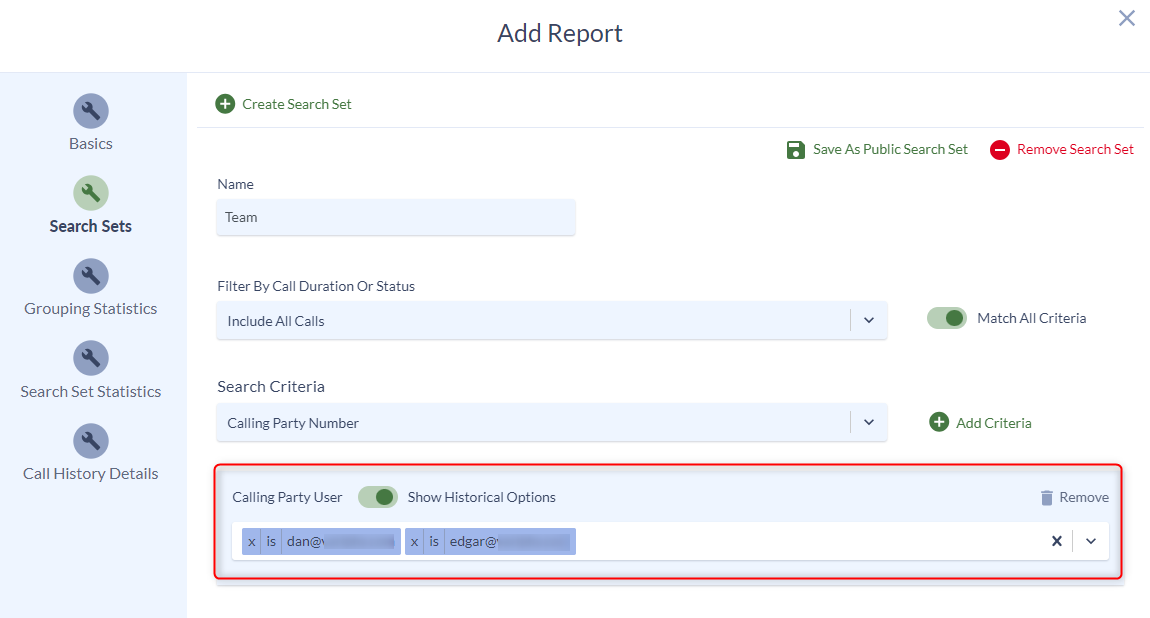
4. Originating from users Dan or Edgar
User-based search sets like Caller/Called User or Caller/Called Department allow for querying of historical user information. Toggling on the Show Historical Options allows you to search on user-based information no longer existing in your Teams hierarchy.
For example, if a user is no longer with the company but you wish to search their name, you can toggle on Show Historical Options and select the user from the pick list. Historical entities will appear with a small flag next to their respective criteria, indicating it is a historical entity.
Search Set Statistics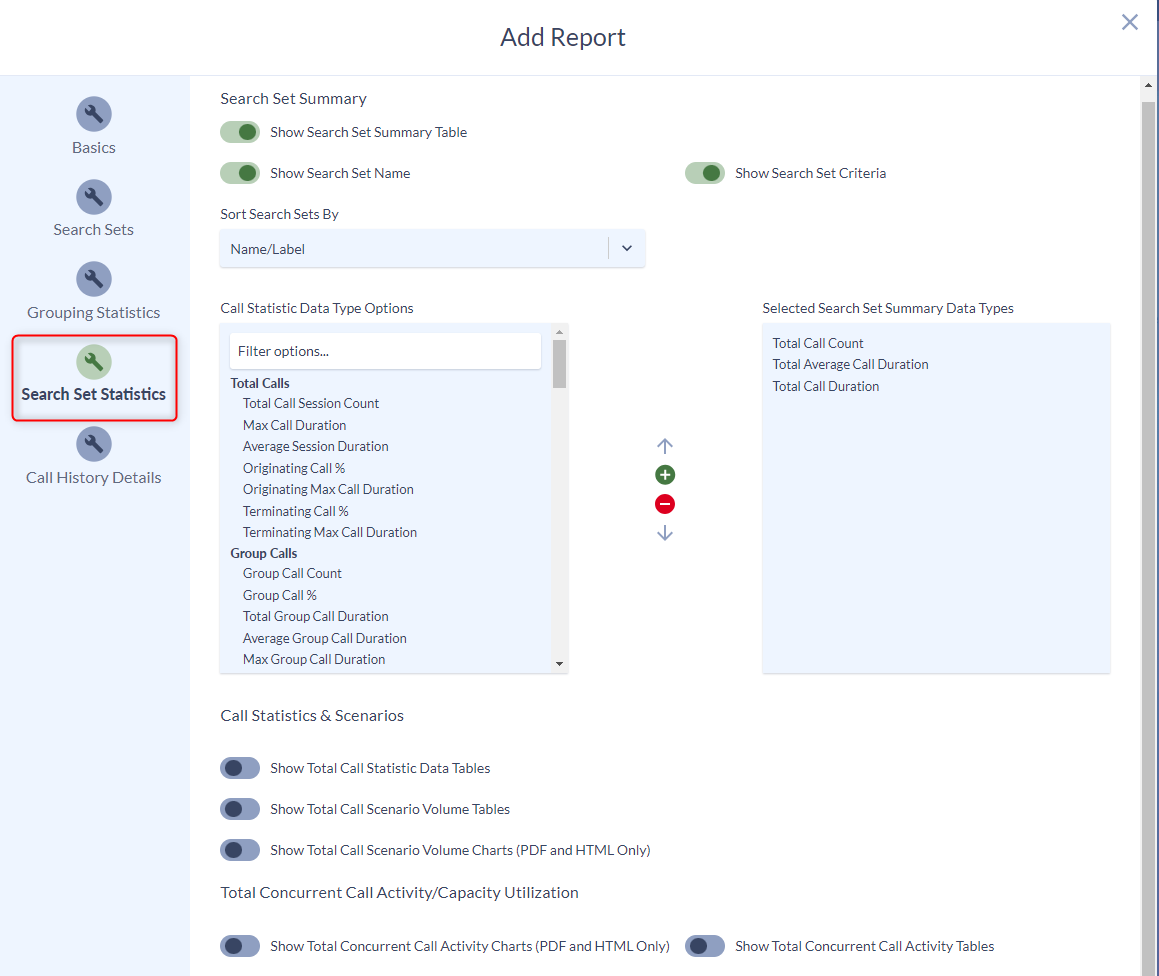
The Search Criteria Summary section will display one or more selected statistics per search set/criteria as well as total cumulative values (if the report contains multiple search sets).
To enable or disable the Search Criteria Summary, toggle the Show Search Set Summary Table option within the Search Set Statistics tab.
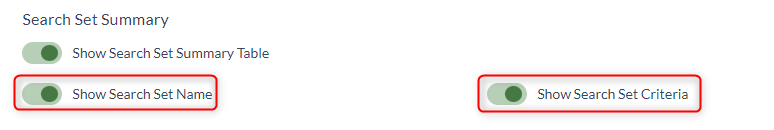
If the Search Criteria Summary is shown, enable or disable displaying the name or criteria of the search set by toggling the Show Search Set Name and Show Search Set Criteria options, respectively.
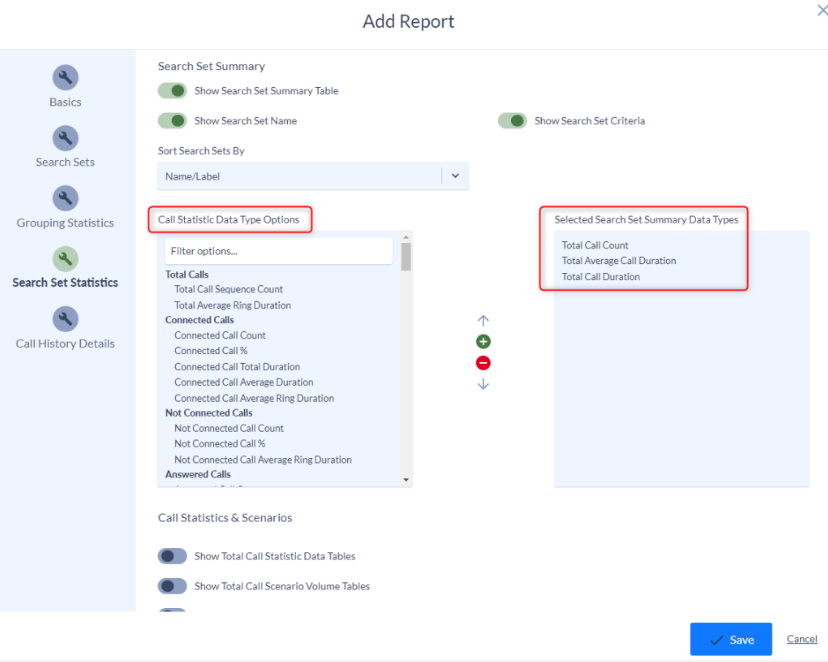
Call Statistic Data Type Options
For each search set/criteria, Variphy offers an extensive set of call statistics options to choose from, such as:
- Total Call Count
- Total Average Call Duration
- Total Call Duration
- Not Connected Call Count
- Group Call %
- Peer to Peer Call Count
For more info on call statistics options, read the Variphy Teams Phone Reporting Data Types and Statistics Guide.
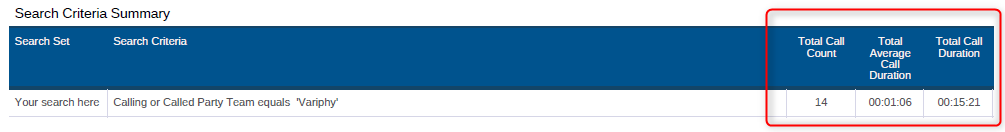
In the below configuration, we chose to show Total Call Count, Total Average Call Duration, and Total Call Duration data types by moving them from the left to the right.
The output of the selected data types above would appear as follows:
Call Statistics and Scenarios
The Call Statistics & Scenarios section provides additional summary layers into your report, allowing you to add period-over-period tables, in-depth analytics, and period-over-period charts.
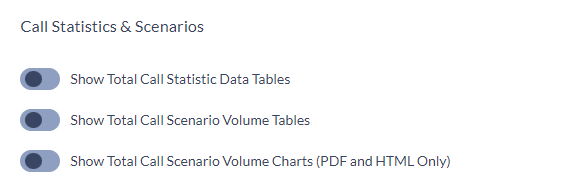
Total Call Statistic Data Tables
This section represents a breakdown of key statistics, computed for each desired time unit type (e.g., Hour of Day vs. Day of Week).
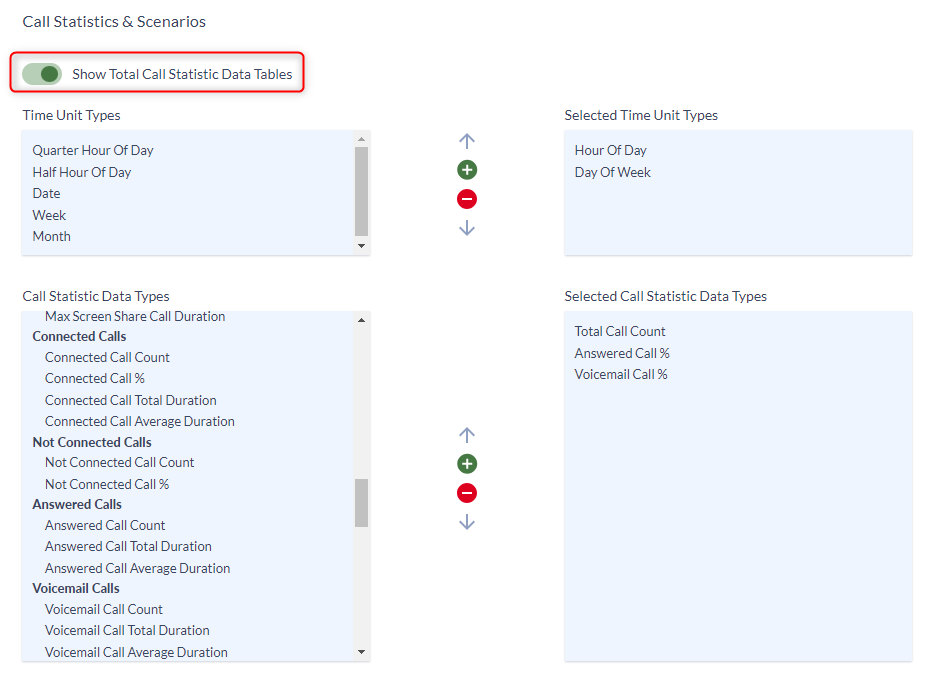
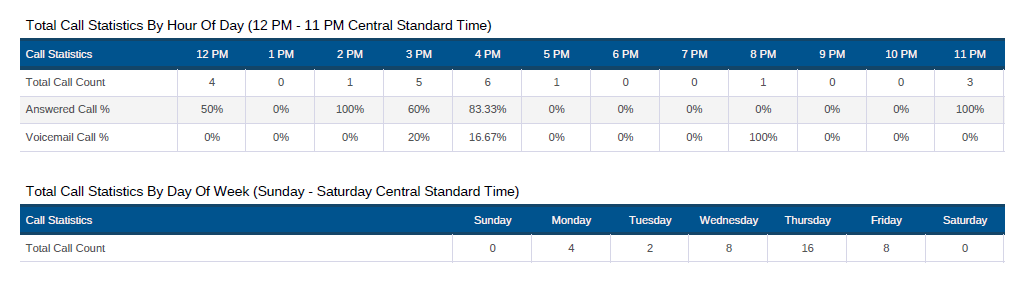
The following example report output shows three call statistics (Total Call Count, Answered Call %, and Voicemail Call %) for the time unit type of Hour of Day as well as Day of Week, which was based on a specific set of 38 calls, resulting from its search set criteria.
- 83.33% of 38 total calls were answered between 4:00:00 PM and 4:59:59 PM PDT
- 0 calls took place between 7:00:00 PM and 7:59:59 PM PDT as well as 9:00:00 PM and 11:59:59 PM PDT
- An hourly high of 20% of 38 total calls were voicemail calls between 3:00:00 PM and 3:59:59 PM PDT
- A Day of Week high of 16 total calls took place on Thursday as compared to other days of the week
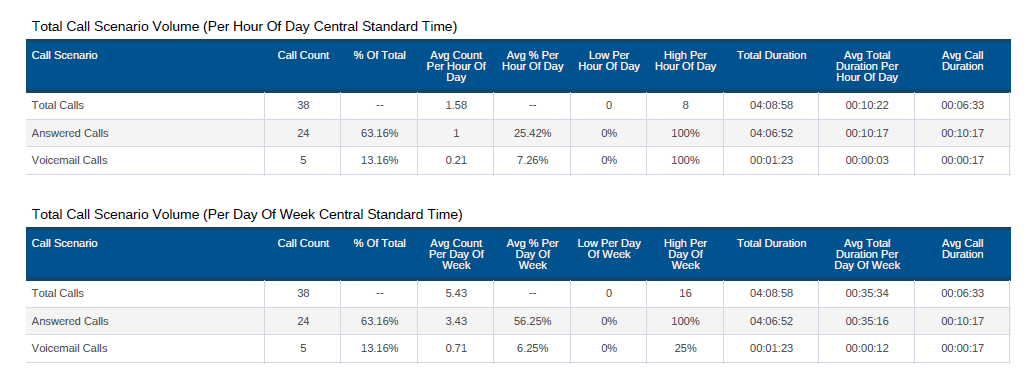
Total Call Scenario Volume Tables
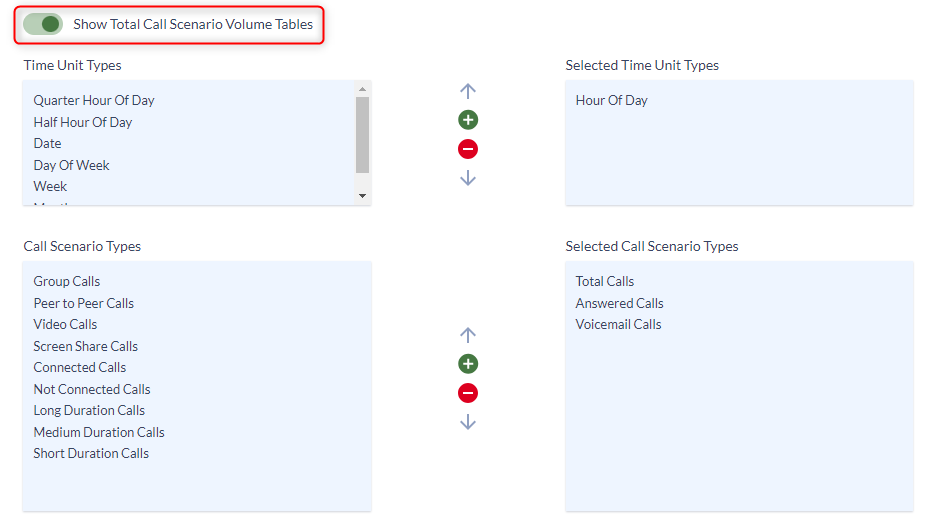
This table represents an analytical “summary” of the call volume for each of the selected call scenario types, computed for each desired time unit type (e.g., Hour of Day vs Day of Week). It produces tables showing metrics like the low, high, and average call count/volume per call scenario, computed for each time unit type.
The following example report shows three call scenarios (Total Calls, Answered Calls, and Voicemail Calls) for the time unit types Hour of Day and Day of Week, which was based on a specific set of 38 calls, resulting from its search set criteria.
- 63.16% (24 of the 38 total calls) were answered
- 13.16% (5 of the 38 total calls) went to and were connected to voicemail
- Per Hour of Day, the average number of calls was 1.58, with 25.42% answered and 7.26% going to voicemail
- The low number of total calls per hour was 0 and the high was 83
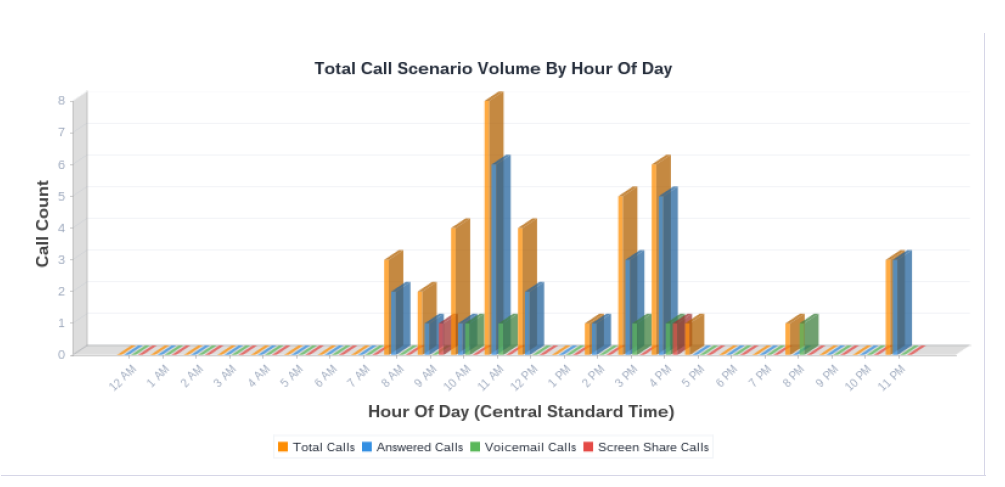
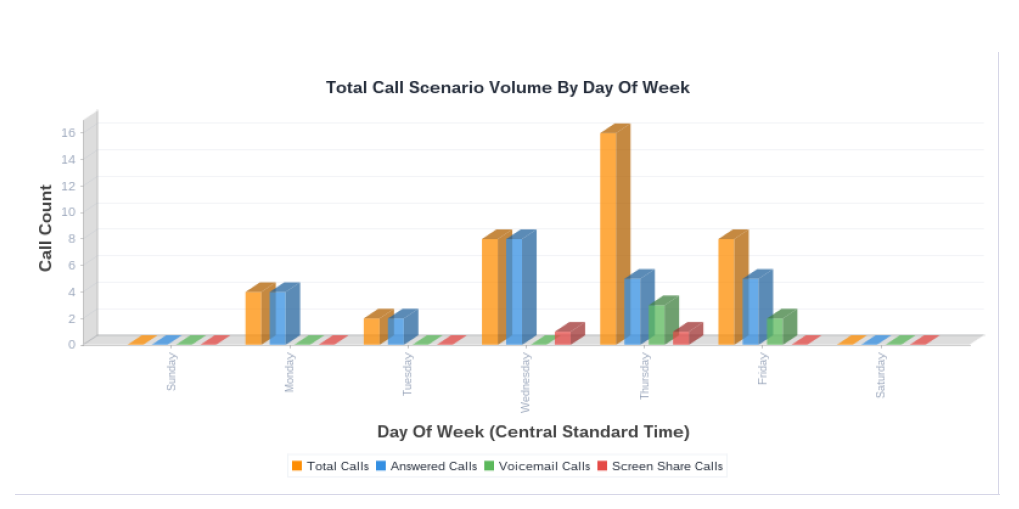
Total Call Scenario Volume Charts
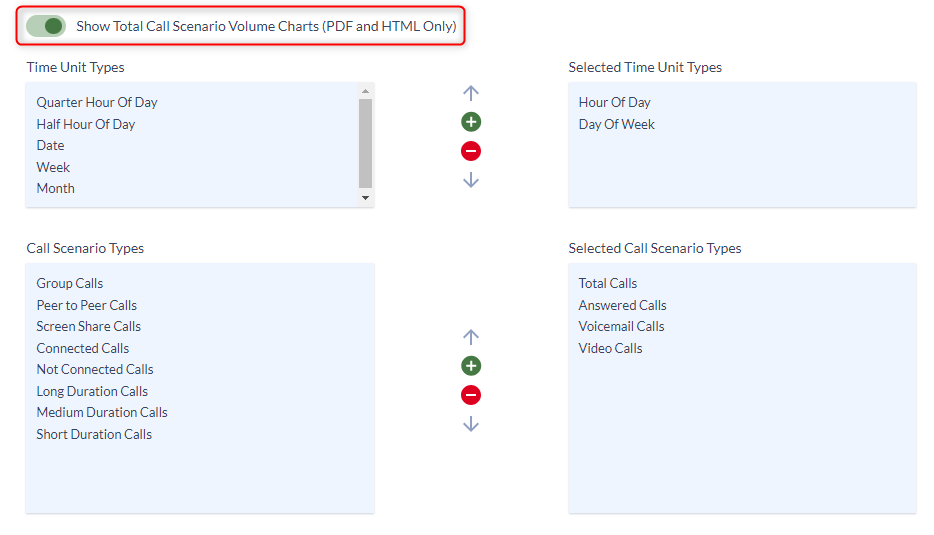
Similar to the Total Call Scenario Volume Tables, this chart represents an analytical “summary” of the call volume for each of the selected call scenario types, computed for each desired time unit type (e.g., Hour of Day vs. Day of Week), but in vertical bar chart format.
The following output shows four call scenarios (Total Calls, Answered Calls, Voicemail Calls, and Screen Share Calls) for the time unit types Hour of Day and Day of Week, which was based on a specific set of calls, resulting from its search set criteria.
Concurrent Call Activity
Variphy can compute the Concurrent Call Activity, which is the number of concurrent calls taking place, for each second in time (within the search time window used when generating a report) for the calls identified by the report’s search set criteria. This flexible approach ensures reports can measure and show concurrent call activity for any set of calls, whether company- or cluster-wide or a granular data set like calls to a helpdesk or series of users.
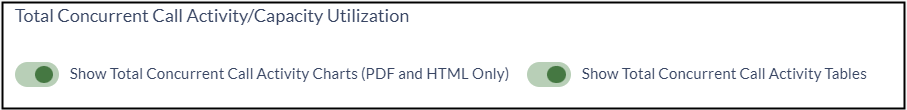
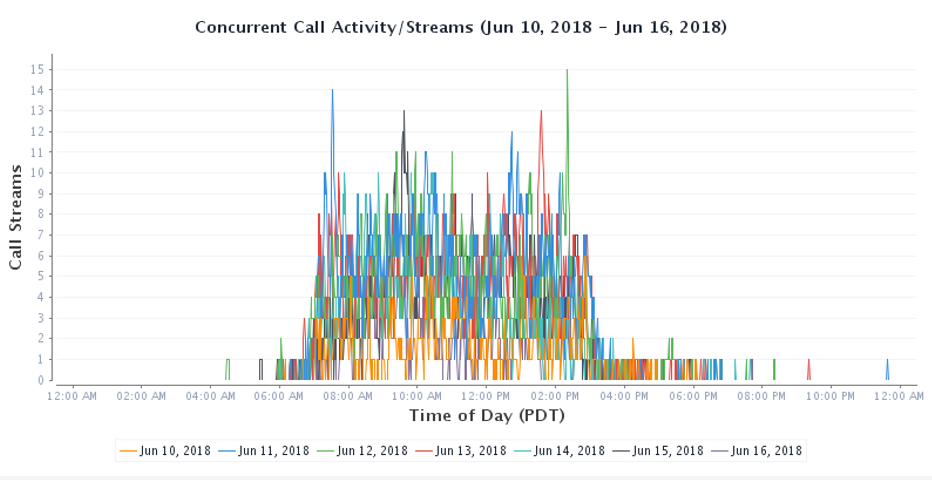
Concurrent Call Activity Chart
This content option illustrates the concurrent call activity per date (e.g., June 10, 2018 vs. June 11, 2018) per time of day. As the following example shows, the peak number of concurrent calls was 15, just after 2:00 PM PDT on June 12, 2018.
Each date will be displayed as a different color, e.g., June 12, 2018, is green.
Because too many colors and lines on the same chart can make it difficult to read, Concurrent Call Activity charts will show a maximum of 7 days per chart. When the search time window includes more than 7 days, multiple charts will be used.
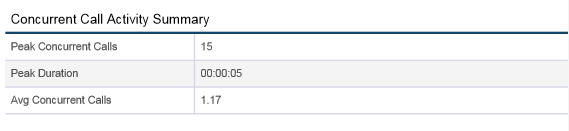
Concurrent Call Activity Summary
This table provides a brief summary of the Concurrent Call Activity, showing:
- The peak number of concurrent calls (e.g., 15)
- The number of seconds in which the peak number of concurrent calls took place (e.g., 5 seconds)
- The average number of concurrent calls over the entire search time window (e.g., Previous Week)
Concurrent Call Activity Table
The Concurrent Call Activity table reveals the total time duration and percentage of time (for the Search Time Window – “Previous Week” in this example) for which the specific number of concurrent calls were taking place. The output below shows that there were 15 concurrent calls for a total of 5 seconds (00:00:05). The Time Window Percentage column on the right shows the 5 secs is ~ 0.0% of the total Search Time Window (Previous Week).
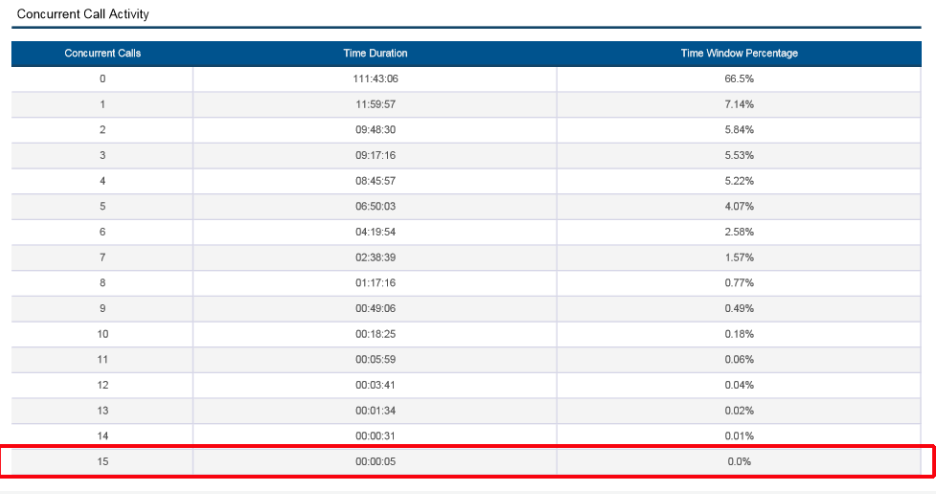
The example above can be produced with the following configuration in the “Concurrent Call Activity” section towards the bottom of the “Call Analytics” tab:
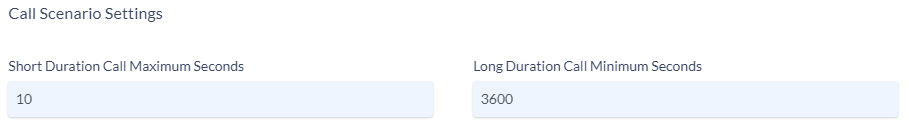
Analytics Call Scenario Settings
Call Scenario Settings can be configured for the specific report to identify what constitutes a “long” vs. “short” duration call. Default values are 3600 seconds (1 hour) for “long” and 10 seconds for “short” duration calls, respectively.
Using the values as shown below, any connected call that lasts for at least 3600 seconds will be considered a “long duration” call while calls that last 10 seconds or less are considered a “short duration.”
Grouping Statistics Summary and Analytics
Grouping is a powerful feature in Variphy call analytics reporting. When analyzing and reporting on a set of call activity, it is helpful to organize or “group” data into groupings like per Caller/Called User, Caller/Called Number, Department, Called Queue, and Location.
Grouping Type
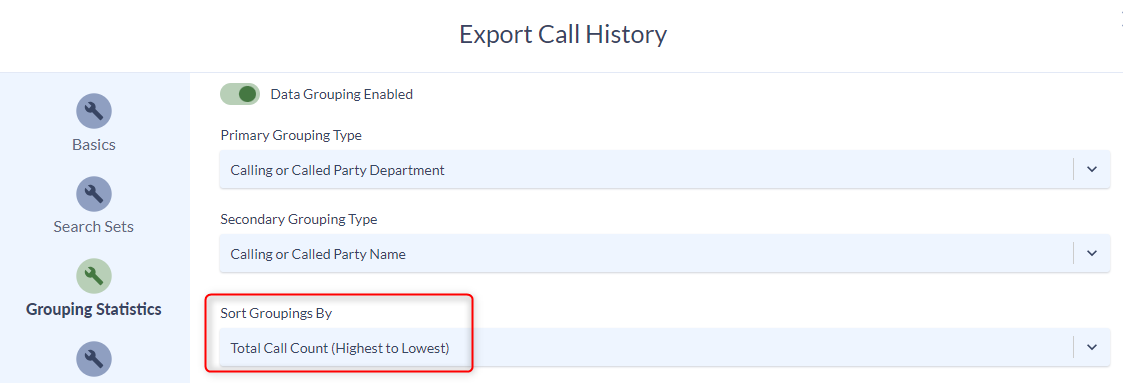
To enable groupings, toggle the Data Grouping Enabled field to ON (green) in the Grouping Statistics tab.
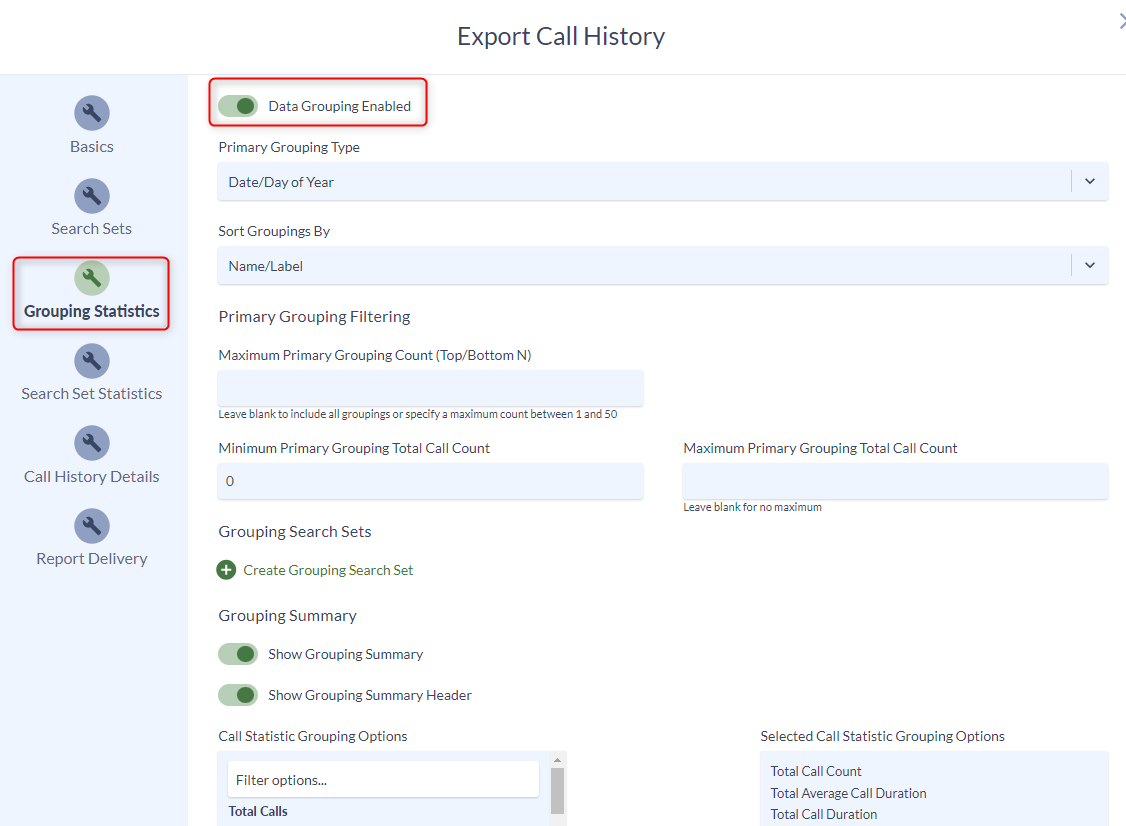
Then, in the Primary Grouping Type field, select the desired Grouping Type. There are many grouping options, many of which are directional, such as Calling or Called Party Name, Calling or Called Department Name. These options will identify which users or departments were involved in each call (per the search set/criteria results) based on the originating Caller Department (department that placed the call), and Called Department (department that ultimately received the call).
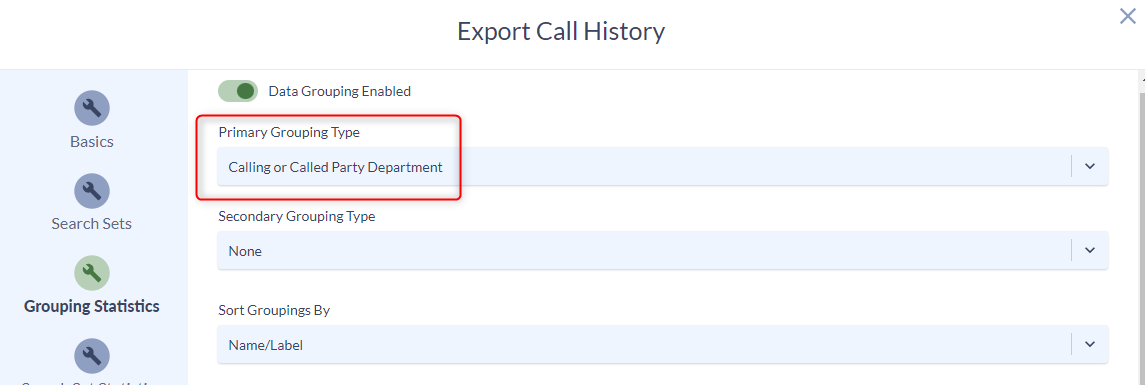
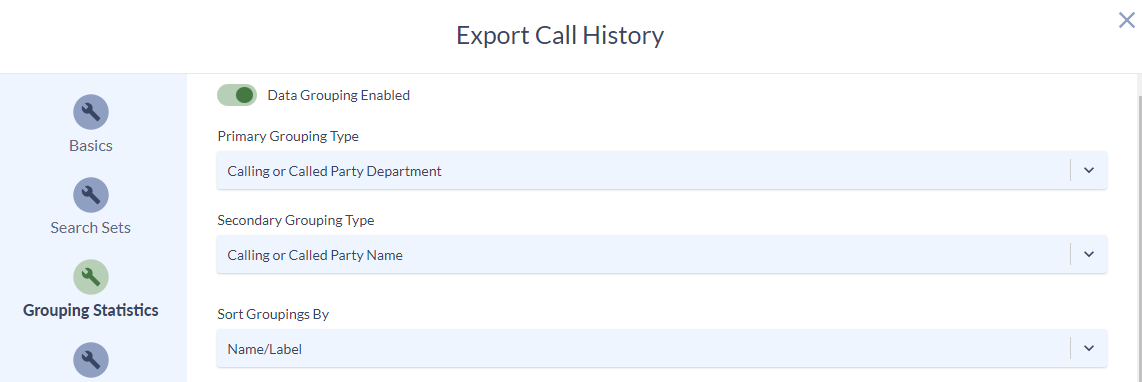
When certain primary grouping types are selected, you will be presented with an option for a Secondary Grouping Type. Secondary grouping is not required but allows reports to summarize both the primary grouping and a second set of criteria.
For example, you may group Calling or Called Party Department and then group secondarily on the user type those users utilized. This would provide a summary not only on the Caller or Called Departments but also the names of each user involved in those calls.
The Sort Groupings By field controls how grouping should be sorted, such as by Name/Label or Total Call Count (Highest to Lowest).
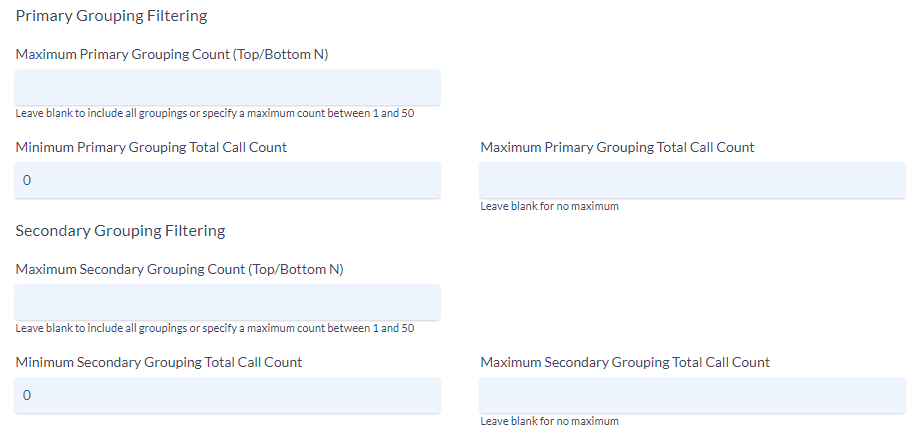
Grouping Filtering
In the Grouping Filtering section, there are additional options to filter out groupings based on the total call count.
If specified between 1 and 50, the Maximum Primary Grouping Count (Top/Bottom N) field will ensure that only the 1st N groupings will appear, according to the Sort Groupings By field.
If specified, the Minimum Primary Total Call Count and Maximum Total Call Count fields can also provide filtering to only include groupings where a certain total call count (or range) is met, such as where the grouping was involved in 0 calls or 1000 calls or more.
Grouping Summary
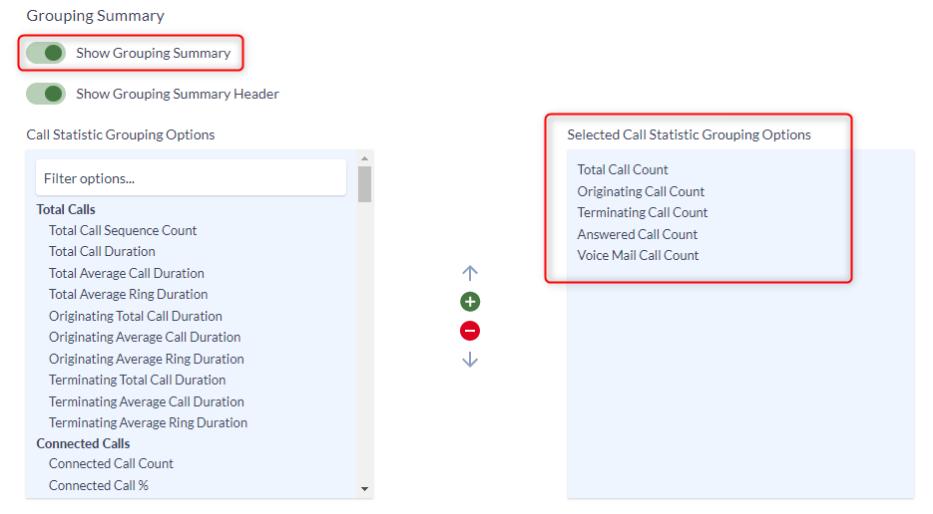
For example, the output below shows a grouping summary for call history that is grouped by Caller or Called User and includes statistics for each. Variphy offers many grouping options.
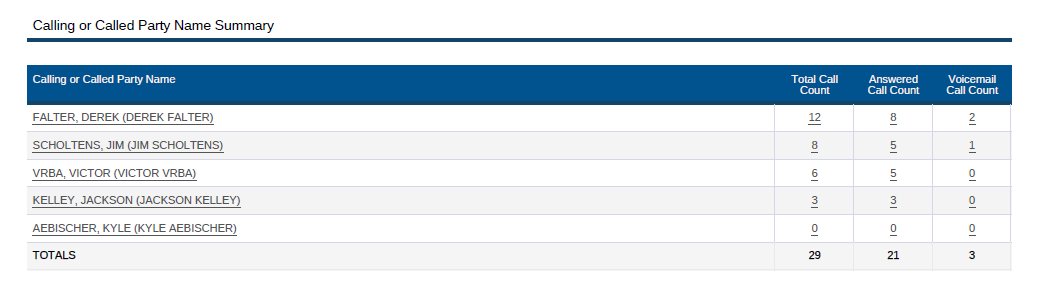
The Grouping Summary section will display one or more selected statistics per grouping as well as total cumulative values (if the report contains several groupings).
Show Grouping Summary is enabled by default within the Grouping Statistics tab. Grouping Summary allows you to select statistics to show per grouping, such as:
- Total Call Count
- Originating Call Count
- Terminating Call Count
- Answered Call Count
- Voicemail Call Count
For more info on the Call Statistic options, read the Variphy Teams Phone Reporting Data Types and Statistics Guide.
If Grouping Summary is enabled, the Show Grouping Summary Header field controls whether a simple section header with text showing the grouping type appears above the Grouping Summary table.
Grouping Statistics and Scenarios
In addition to the Grouping Statistics Summary above, Variphy can also include time-period-based analytics for each grouping in reports, such as:
- Total call count per Quarter Hour (9:00 a.m. – 9:15 a.m., 9:15 a.m. – 9:30 a.m.)
- Total call count per Half Hour (9:00 a.m. – 9:30 a.m., 9:30 a.m. – 10 a.m.)
- Total call count per Hour (9 a.m., 10 a.m.)
- Total call count per Day of Week (Monday, Tuesday)
- Total call count per Date Of Year (Feb 10 vs. Feb 11)
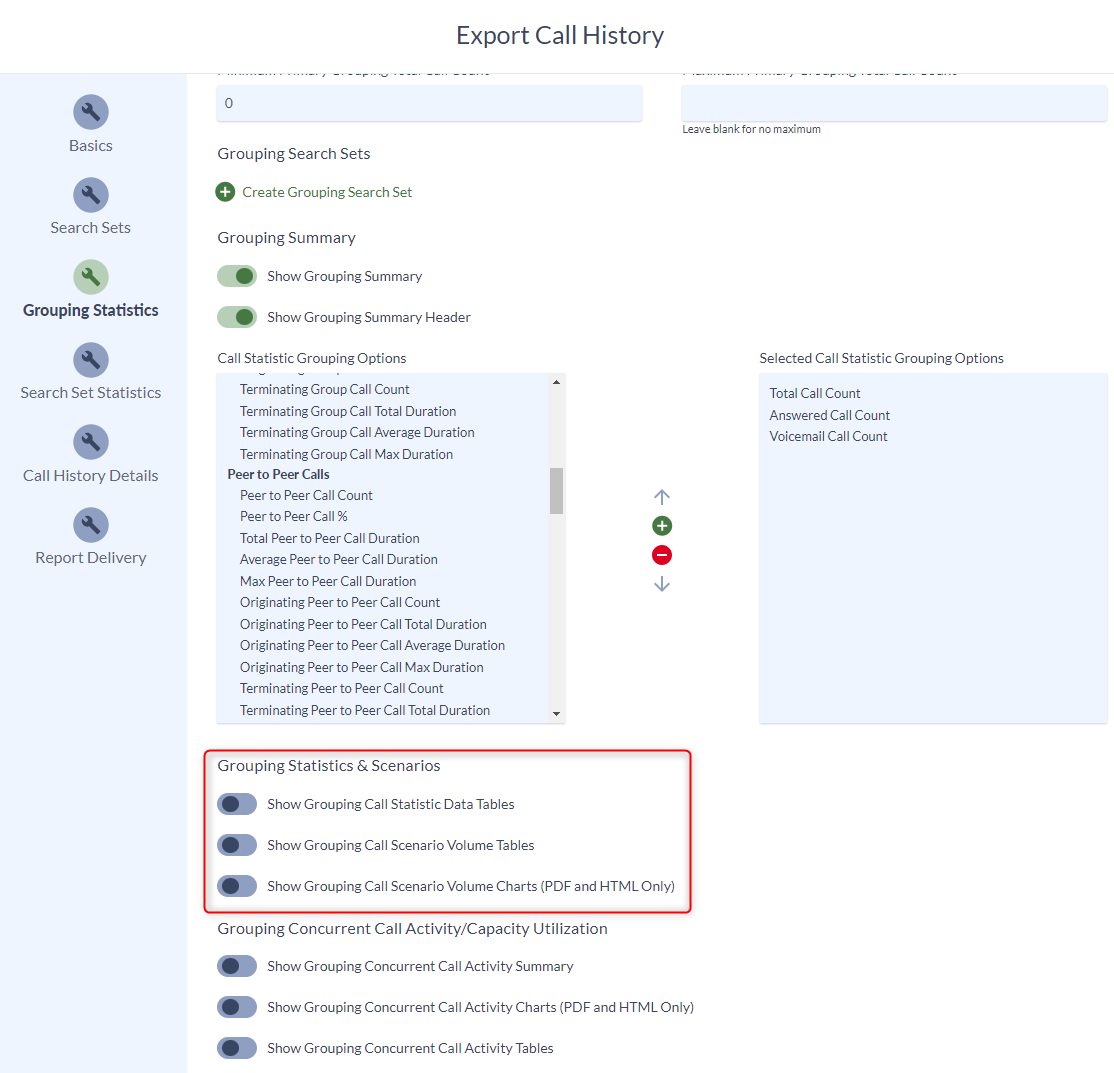
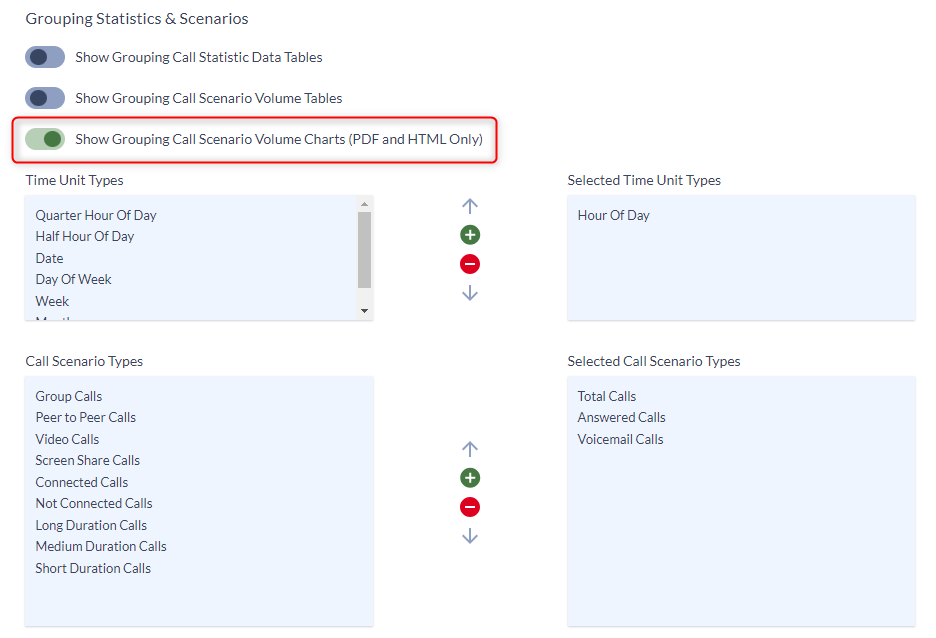
The Grouping Statistics & Scenarios section in the Grouping Statistics tab contains statistical options for time-based tables and charts that can be computed per grouping (e.g., per Device Type, User, Department, Number).
Show Grouping Call Statistic Data Tables
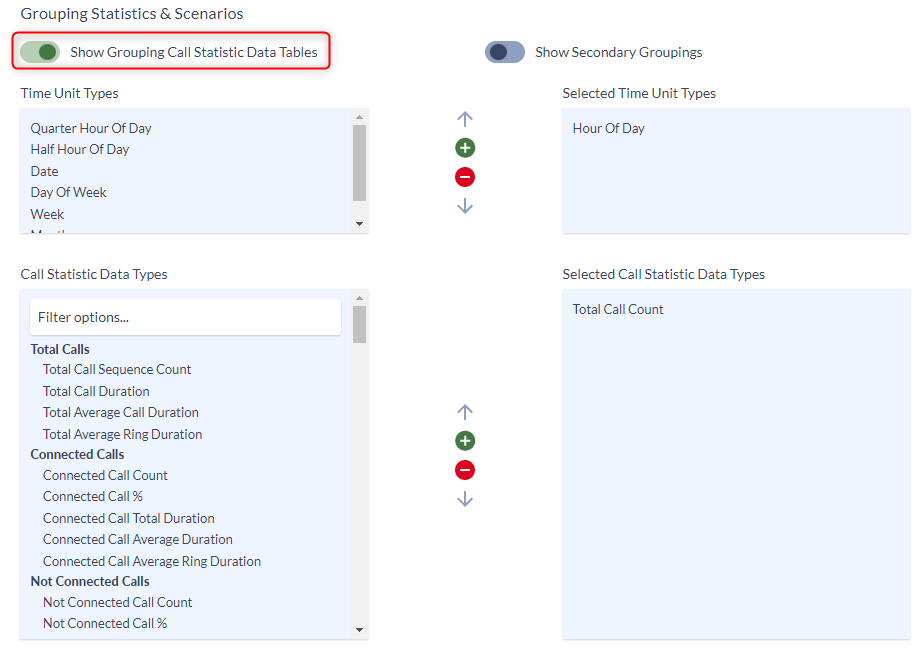
This represents an analytical breakdown of chosen statistics, computed for each desired time unit type (e.g., Hour of Day vs. Day of Week).
Read more about call statistics in the Variphy Teams Phone Reporting Data Types and Statistics Guide.
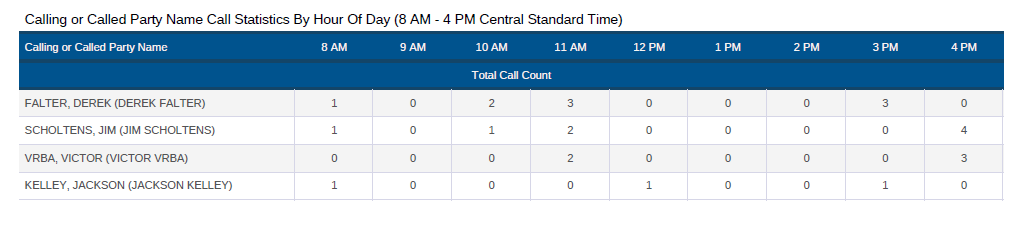
For a grouping type of Calling or Called Party Name, the above configuration would show the following output for Primary Grouping Call Statistic Data Tables, showing the Total Call Count for each party number grouping per Hour of Day.
In this example, the report was run from 8:00 a.m. to 4:59 p.m. only.
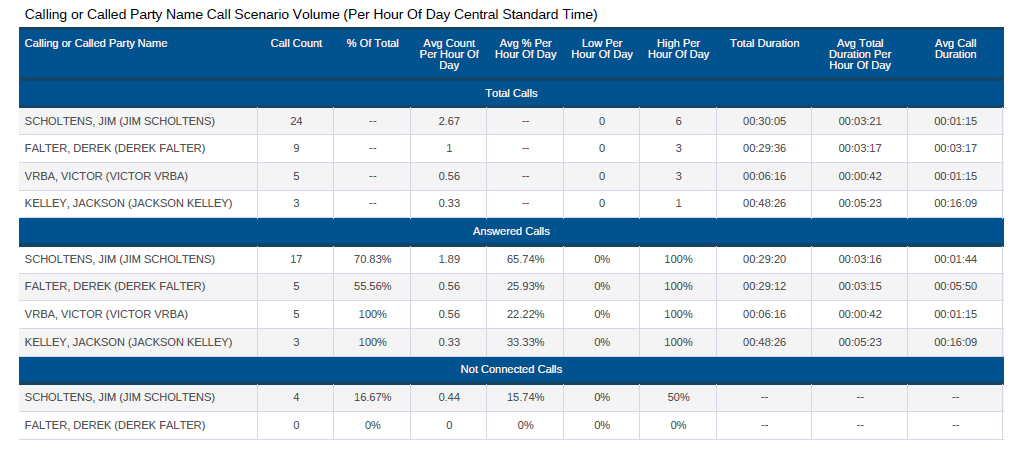
Show Grouping Call Scenario Volume Tables
This represents an analytical summary of the call volume for each grouping, computed for selected call scenario types and time unit type (e.g., Hour of Day vs. Day of Week), producing tables showing metrics such as the low, high, and average call count or volume per call scenario.
Variphy offers many call scenarios to choose from. Read more about call scenarios in the Variphy Teams Phone Reporting Data Types and Statistics Guide.
For the above configuration, the following example report shows three call scenarios (Total Calls, Answered Calls, and Not Connected Calls) per Hour of Day for each user (Calling or Called Party Name).
For Jim, this example Call Scenario Volume Table shows:
- A total of 24 calls were made and received by this user
- Between the hours of 8 a.m. to 5 p.m. (which the report was run for), the average per hour was 2.67 calls
- Per Hour of Day, the average answered call rate was 65.74%
- Overall (across all 388 total calls), 16.67% of calls were not connected
Show Grouping Call Scenario Volume Charts (PDF Only)
This functionality represents a visual summary of the call volume for each grouping, computed for each selected call scenario type and time unit type (e.g., Hour of Day vs. Day of Week), producing bar charts summarizing each of the call scenarios.
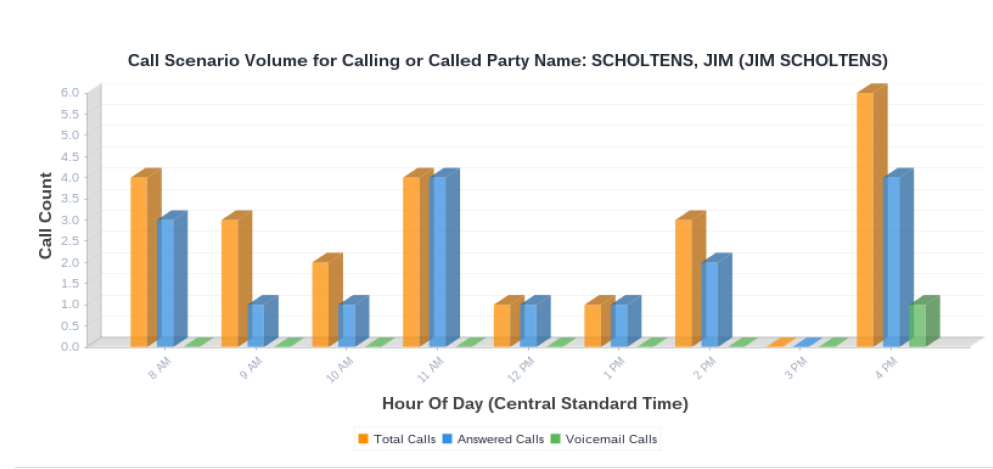
For the above configuration, the following example shows three call scenarios (Total Calls, Answered Calls and Voicemail Calls) per Hour of Day for the user named Jim. Each user (Calling or Called Party Name Grouping) will have its own graphical representation of call scenario.
Call History Details
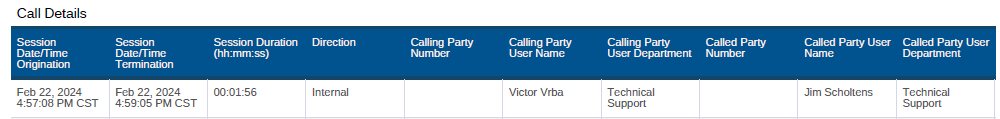
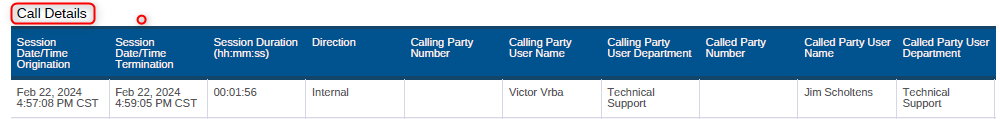
If enabled, the Search Result Details section will contain call details for the original search results in a tabular format.
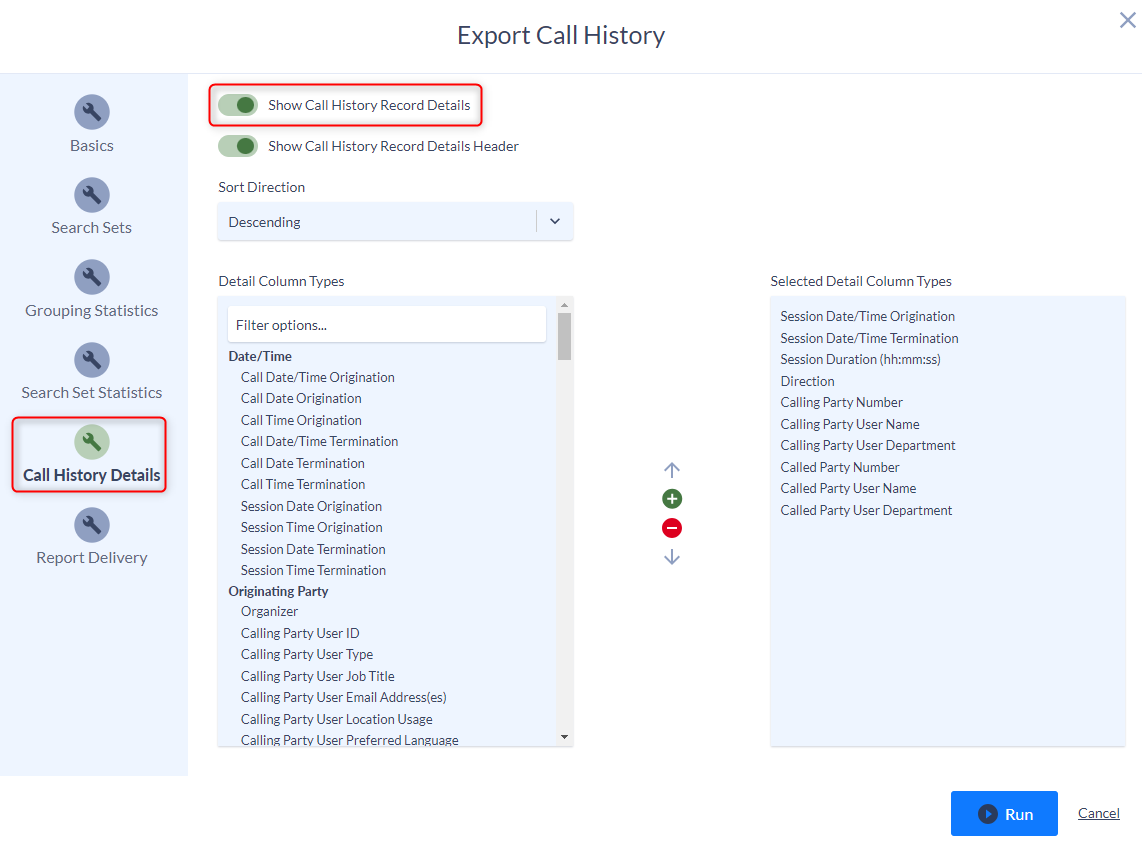
To enable or disable this section, toggle the Show Call History Record Details option with the Call History Details tab.
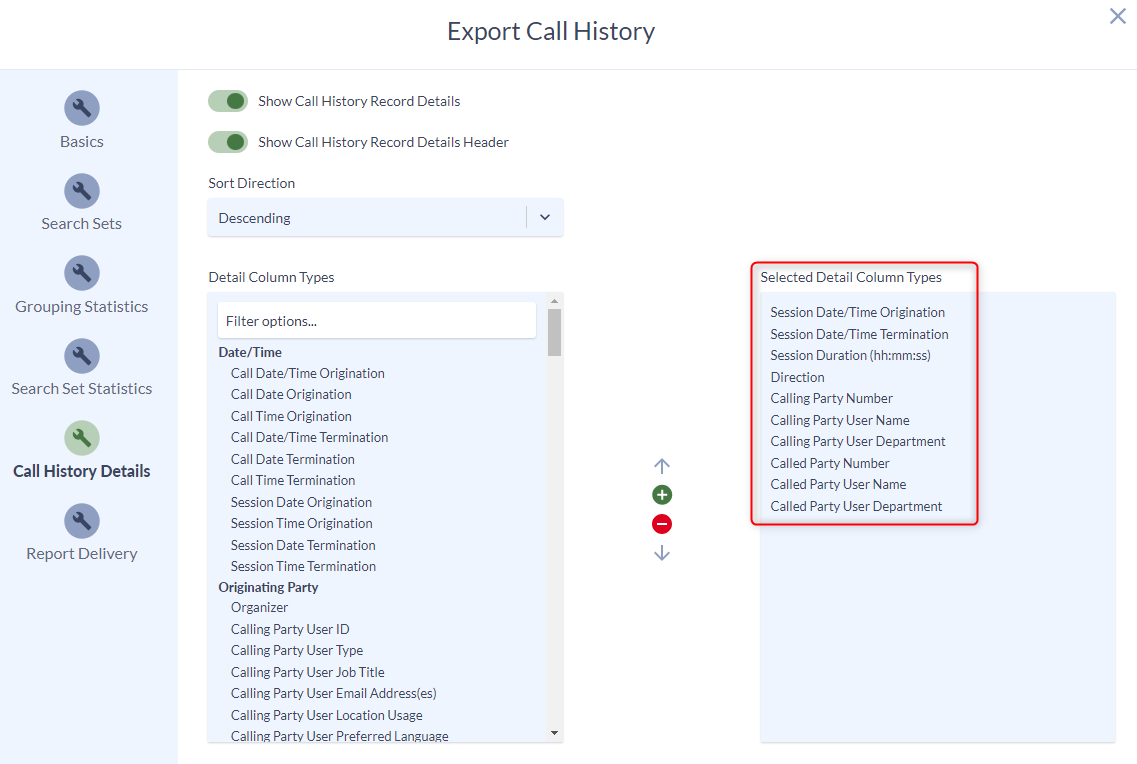
If enabled, select at least one option from a variety of history detail columns, including:
- Session Date/Time Origination
- Session Date/Time Termination
- Session Duration
- Direction
- Calling Party Number
- Calling Party User Name
- Calling Party User Department
- Called Party Number
- Called Party User Name
- Called Party User Department
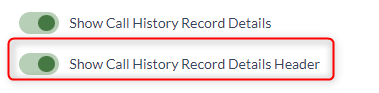
Toggle the Show Call History Record Details Header option to enable or disable the “Call Details” section header in the report.
The example output above can be produced with the following configuration in the Call History Details tab:
Still Need Help?
Email our support team at support@variphy.com or click the button below to access our ticket portal.
Please provide details about your question or issue, including any applicable screenshots, reports, or Variphy application log files.