Background
In Variphy, the contents of each dashboard is made up of widgets – each with its own configuration. Each widget defines its own data to analyze and/or visualize, via search sets (which define the search criteria for what calls to include) and a time period relative the current time, as ‘Current Day’ or ‘Previous 2 Hours’.
Variphy includes a variety of widget types, which control how the data is shown – enabling you to fully customize a dashboard with the desired charts, data tables, and call counts that make the most sense for you.
By configuring the precise search sets and other configuration options, each widget can be tailored to both represent and visualize the call analytics data the way you want it.
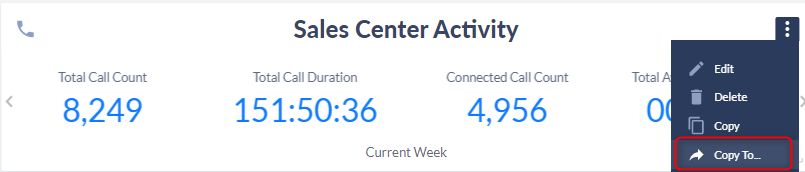
Widgets can be copied, refreshed manually (instead of waiting for the automatic refresh interval), and deleted (removed from the dashboard). Widgets can also be resized and re-positioned in the dashboard by drag and drop with your mouse.
Configuring Widgets
Virtually everything from the type, title, top icon, font color, size, and layout position can be configured, including the time period and search set criteria that the data represents.
When configuring a widget, the “Type” field dictates what type of data is shown and how it is represented, for example a pie or line chart as opposed to a numeric call count.
Adding a New Widget
To create and add a new widget to a dashboard, click the “New Widget” button in the upper right of the dashboard.
Editing an Existing Widget
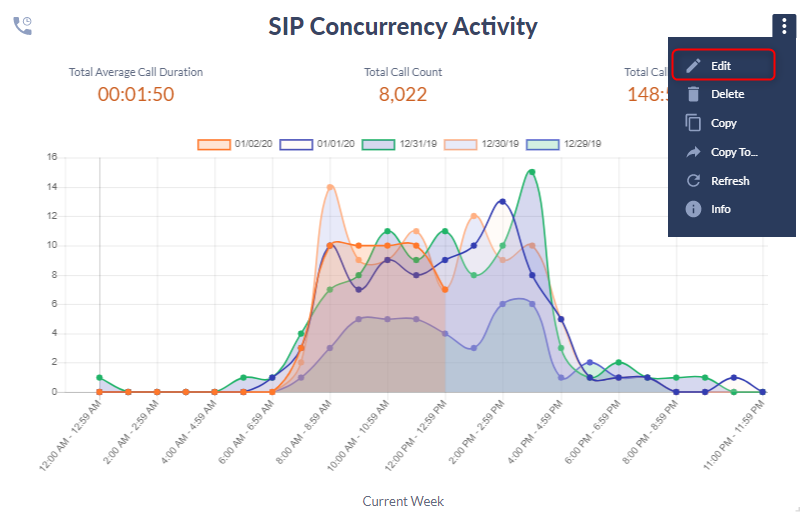
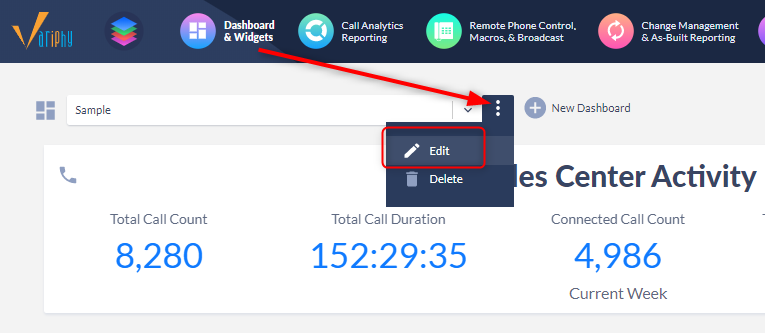
To edit an existing widget, select “Edit” from the widget menu in the upper right corner.
The widget’s Configuration dialog will appear. The widget fields are organized into sections:
Configuration
- Title – the title of the widget along with the checkbox for whether to display the title or not
- Refresh Interval – how often the widget should automatically update its data
- Type – the type of the widget, which controls what is displayed – e.g. count, chart, or data table
- Color Theme – the preferred colors to use in the widget such as for text and charts
- Icon – the icon image at the top center of the widget
- Date Format – the format to use for any/all dates shown in the widget
- Time Format – the format to use for any/all times shown in the widget
- Primary Data Grouping – for applicable types (Call Distribution and Top N) this defines how the CDR data should be organized and grouped
- Result Display Count – for applicable types (Call Distribution, Call History Details, and Top N) this defines how many results to show or chart in the widget
- Time Period – for the Call Volume by Time Period type only, this defines what time unit to use for the call volume charting, such as per Day of Week or Hour of Day
- Selected Detail Columns – for Call History Details type only, this defines which call details to show (and in which order) in the widget per call
- Sort Direction – for Call History Details type only, this defines whether the least or most recent calls are shown
Search Sets
- Private Search Sets – any private (specific to this widget) search sets and associated criteria
- Public Search Sets – any public/re-usable search sets and associated criteria
- At least 1 Search Set (private or public) must be configured for each widget
Time Period
- When – the time period to search for CDR/Call Analytics data
- Exclude Days of the Week – any days to be excluded from the time period searched (such as for Mon-Fri only)
- Time of Day – the daily time window desired, by default all hours (12:00AM – 11:59PM assumed)
- Time Zone – the time zone to use for the time period as well as any date/time calculations for the widget
Call Analytics Widget Types
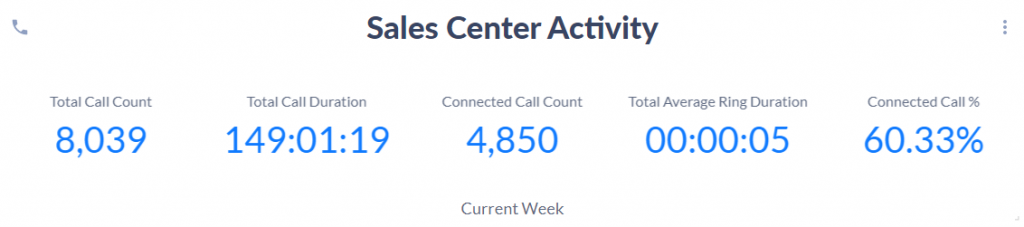
Call Statistic
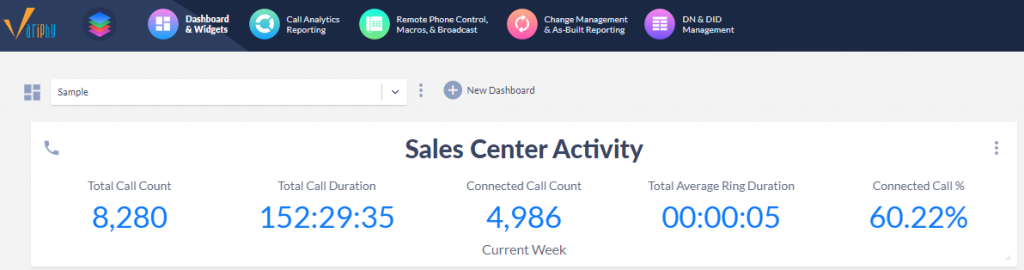
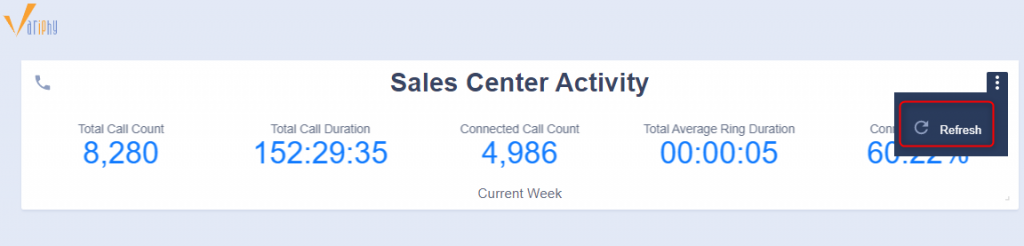
This widget type provides a total unique call count for the specified search sets and time period.
This example shows key sales center activity metrics for the current day, via the following configuration:
- Type = Call Statistic
- Search Sets = Search sets/criteria which correctly identifies all the international calls, such as where Original Called Party Number starts with 011
- Time Period = Current Week
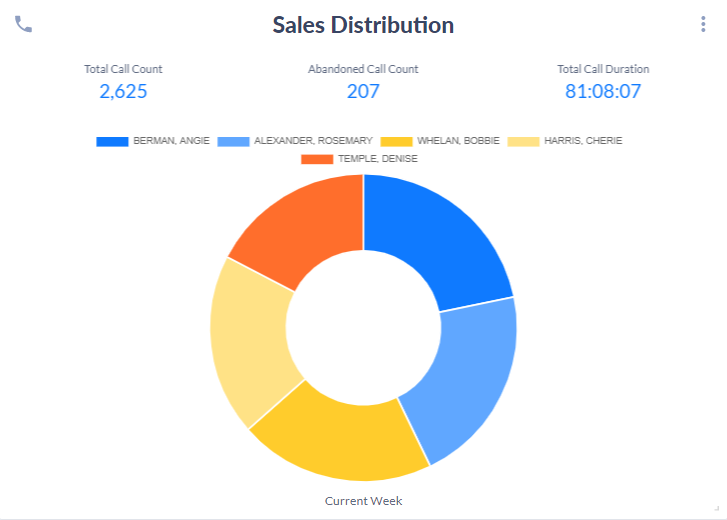
Call Distribution
This widget type uses a pie chart to show the total unique call count per primary grouping for the specified search sets and time period.
In this example, all the inbound calls to the call center are organized (grouped) per answering number (final called party number), via the following configuration:
- Type = Call Distribution
- Primary Data Grouping = Final Called Party Number
- Result Display Count = 5 (only the top 5 groupings/pie slices should be shown)
- Search Sets = Search sets/criteria which correctly identifies all the inbound calls to call center, such as where Original Called Party Number equals with 1400, grouped by Terminating Agents.
- Time Period = Current Week
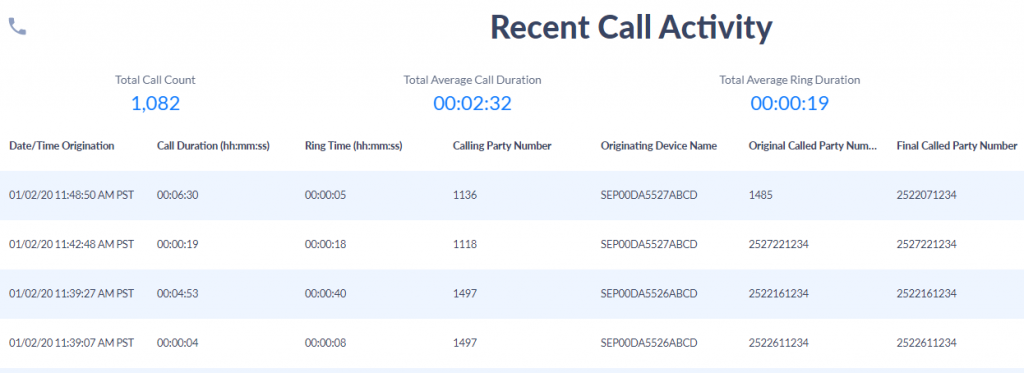
Call History Details
This widget type uses a table to show selected detail columns for each call detail record matching the specified search sets and time period.
In this example, all the inbound calls to the call center are organized (grouped) per end user, via the following configuration:
- Type = Call History Details
- Result Display Count = 10 (only the 1st 10 calls should be shown)
- Selected Detail Columns = Date/Time Origination, Call Duration (hh:mm:ss), Ring Time (hh:mm:ss), etc.
- Sort Direction = Descending (most recent first)
- Search Sets = Search sets/criteria which correctly identifies the desired set of calls, such as where Originating Device Name starts with ‘SEP’
- Time Period = Current Week
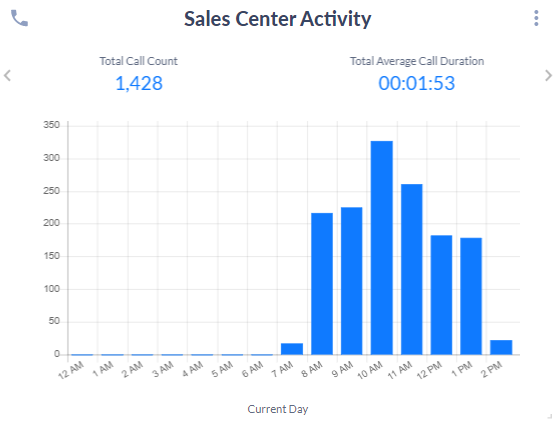
Call Volume By Time Period
This widget type uses a vertical bar chart to show the total unique call count per hour of day (e.g. 8-9am, 9-10am, etc) for the specified search sets and time period.
In this example, the current week’s volume of calls to the call center are charted per hour of the day, via the following configuration:
- Type = Call Volume By Time Period
- Time Period = Hour Of Day
- Search Sets = Search sets/criteria which correctly identifies all the inbound calls to call center, such as where Original Called Party Number equals with 1400
- Time Period = Current Week
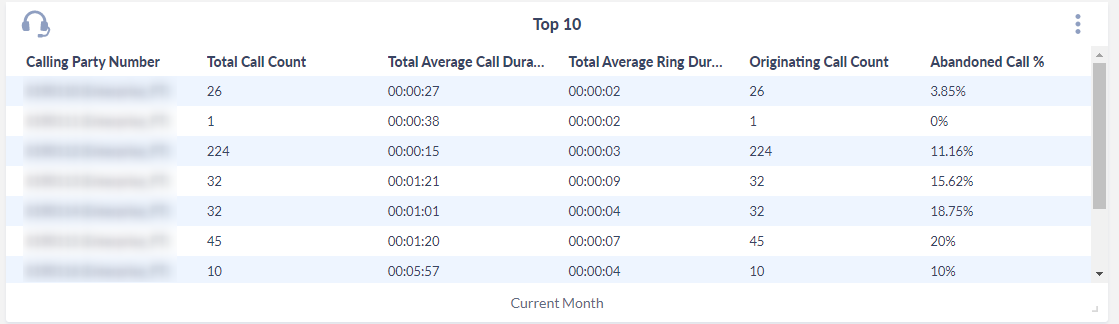
Grouping Statistics
This widget type shows the top ‘N’ groupings values (e.g. dialed numbers, terminating devices, users, etc) for the specified search sets and time period.
In this example, the top 5 originating numbers (calling party numbers) for the current day are shown, via the following configuration:
- Type = Grouping Statistics
- Primary Data Grouping = Calling Party Number
- Result Display Count = 5 (meaning ‘Top 5’)
- Search Sets = Search sets/criteria which correctly identifies all the inbound calls to call center, such as where Calling Party Number equals 2XXX
- Time Period = Current Day
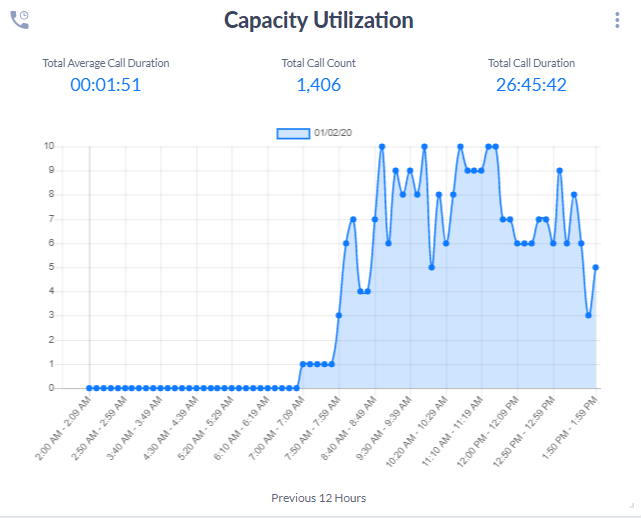
Utilization/Concurrent Call Activity
This widget type shows the number of concurrent/simultaneous call streams throughout the day for the specified search sets and time period. To boost chart performance, Variphy Insight plots the peak number of concurrent calls for 10 minute windows.
In this example, the capacity utilization of the SIP CUBE (with CUCM device name of SIP-CUBE) is , via the following configuration:
- Type = Utilization/Concurrent Call Activity
- Search Sets = Search sets/criteria which correctly identifies all the inbound calls to call center, such as where Originating or Terminating Device Names equals ‘SIP-CUBE’
- Time Period = Previous 12 Hours
Creating Multiple Dashboards
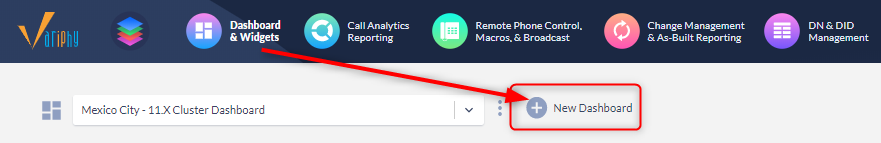
Variphy provides the ability to create numerous Dashboards for the environment’s needs.
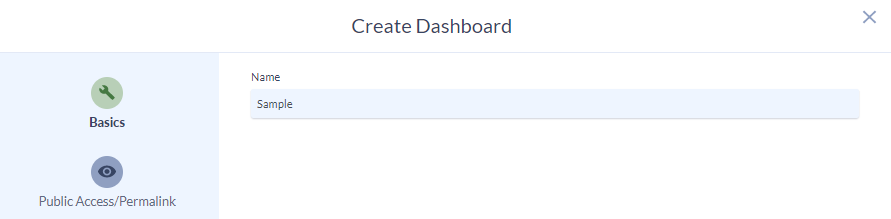
Simply define new Dashboard name:
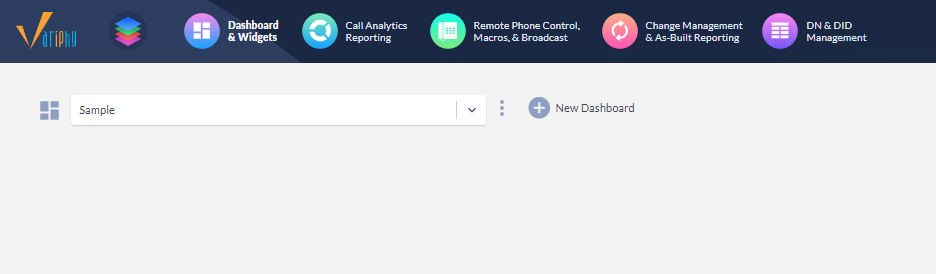
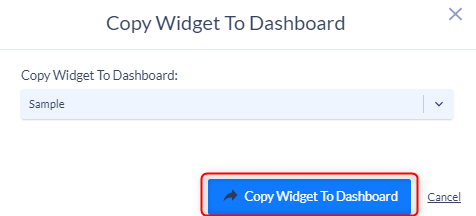
Widgets can be created from scratch on the new Dashboard, or preexisting Dashboard widgets may be copied over to the new Dashboard
Public Access or Permalinking
Available for all Dashboards, but turned off by default. Dashboard Permalinks do not require a user login to utilize.
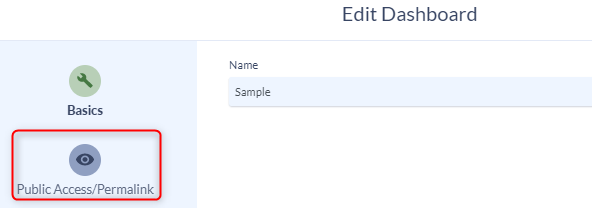
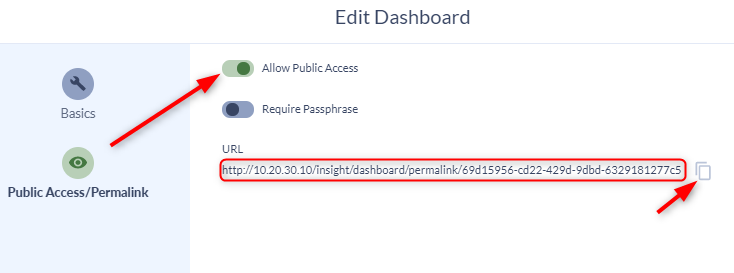
Enabling the Public Access with provide a Read-Only Dashboard URL.
No Admin functionality is possible with a Permalink URL; all modules are stripped from the Dashboard and the only functionality is to change font size or widget scaling
Users can move around and resize widgets to their hearts’ content on a Permalink Dashboard, but as soon as the browser is refreshed, the Permalink Dashboard will return to its original constructed layout (with current data of course).