CSQ based report designed for individual CSQ breakdowns. The report is intended to provide queue managers a detailed overview of individual CSQs productivity, graphical trending Day over Day and Hour over Hour.
Commonly run weekly to track volume trends and validate organizational or procedural changes are impacting Service Levels, Abandonment rates and Queue Times for specific CSQ’s.
Required Changes
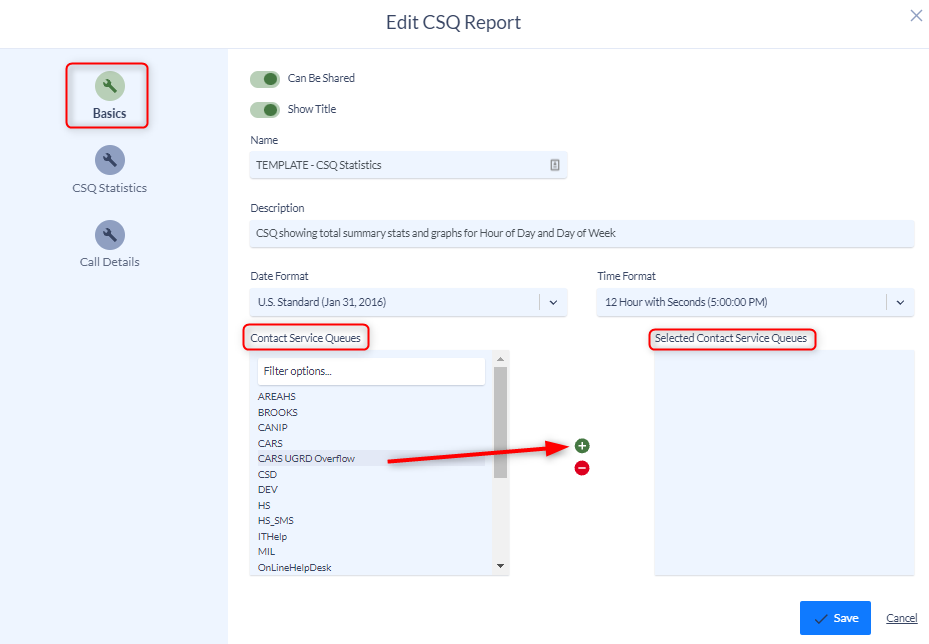
Because the report does not automatically know what CSQ’s you wish to report you will need to add the desired CSQ(s) to the report.
- Edit the report.
- On the Basic page scroll down to the “Contact Service Queues”
- Highlight the CSQ(s) you wish to add to the report.
- Click the + sign to move the selected CSQ(s) into the “Select Contact Center Queues” list.
- Because this report provides detailed summary information on each CSQ it is not recommended to add all CSQ’s into this report.
5. Save and then run your report.
Optional Changes
The Summary Statistics The report is designed with standard summary values. You can add or remove summary values, change the order of the Summary Sections and adjust sorting by editing the report and navigating to the CSQ Statistics menu.
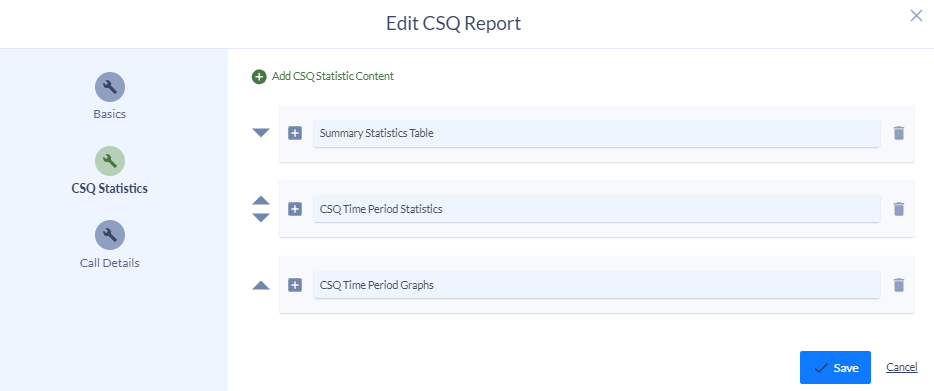
Clicking the Up/Down triangles next to each Summary Section will allow you to move the different sections of the report up or down.
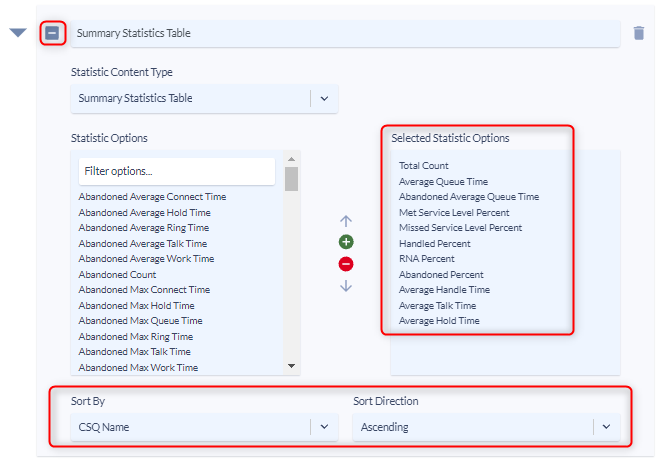
Clicking the + symbol next to the Summary Section will expand the summary menu showing the criteria added into that Summary Section of the report.
Once expanded you can add or remove additional summary values and change the order in which the report is sorted.
To add additional Summary Sections into the report click the “Add CSQ Statistic Content” at the top of the page.

Additional information on adding new content can be found under the Variphy UCCX Call Analytics Reporting Guide.