One of the first steps any technician takes while troubleshooting is to take a look at the software logs. This is no different for the Variphy software. This document will cover everything you need to know about the logs.
Where are the logs?
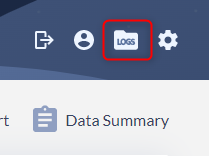
The Variphy logs can be found by clicking on the Logs icon in the top right corner of the web page (right next to Settings). This will take to you to Log Files menu. You need to have administrator rights to see the Logs icon.
In the Log Files menu you have three options:
- Log File – A dropdown list, it contains all of the available log files.
- View – Displays the contents of the selected log file on the screen
- Download All Logs – The software will zip up all of the software log files and download them thru your browser.
The Log Files
The software has multiple logs and each log is separated into multiple log files. The individual log files can grow to 3 MB in size and once the size limit is reached the file is archived and a new file is created.
The current file for each log is named logname.log (example: insight.log). In previous versions of the software the file extensions are renamed as newer files are created. For example insight.log becomes insight.log.1 and insight.log.1 becomes insight.log.2 and so on. The higher the “log.#” extension the older the file is. The software will limit how many file are kept for each log, usually 25 or 50, it depends on the configuration.
In the current version the logs are renamed to include the date/time stamp when the log reached the 3 MB threshold. For example insight.log becomes insight.2022-07-15-1742.log and a new insight.log file is created.
The log displayed in the Log Viewer does not automatically refresh.
Below you will find a list of all of the Variphy logs with a brief description:
- access – shows login information for local Variphy accounts.
- app-err – software errors
- app-out – output errors
- auth – user login attempts with http requests as they navigate the software.
- broadcast – logs from the Broadcast feature.
- ccx-analytics – almost everything CCX: widgets, reports, queries, just not the Real Time Agent widget. Some db connection logging can be found in the insight log.
- cdr-processing – THE processing logs. Do you want to see if the Variphy software is processing data? Check these logs.
- cucm-sync – logs from the cluster based CUCM sync
- dao-save-detailed
- dashboard – dashboard logs. Cashed data, fetch times, number of records found.
- date-time-window
- deadlock-sql-log – deadlocked sql queries are logged here. A SQL deadlock occurs when two or more processed lock the same resource.
- failed-sql – If a SQL statement fails you’ll find it here.
- hibernate-engine – logs from the hibernate engine
- insight – A little bit of everything can be found here. This is a great place to start your troubleshooting.
- installation – installation and upgrade logs.
- jpa-query – JPA query logs
- kafka.log
- migration-details
- output – Miscellaneous messages and logs, in newer versions most of the logging has been moved to app-err and app-out logs.
- perf – system performance
- phonecontrol – button selections within phone control with user name and IP address.
- phonemacro – phone macro logs
- rate-tables – time spent determining rate table costs for each call record via CDR pkid.
- ris-ip-phone-info – Cisco’s Real-time Information Port service provides an API for querying the current connection status of phones, devices and applications. All logging pertaining to the RIS api is contained here.
- smtp – Anything related to the Variphy software communicating with the SMTP server
- sql-log – Everything related to querying the CDR database(s)
- template-engine
- widget-cache – Contains logging on the CUCM and CUBE widget caching.
- xmpp-debug – Logging for our connection to Finesse’s XMPP service. Helpful when troubleshooting the UCCX Real Time Agent Widget.
What to look for…and how to find it.
If you’re about to dig through the software logs then you’re probably looking into an issue or looking for an error. The logs contain a few different types of messages: INFO, DEBUG and ERROR.
Line 224: 2022-05-26 00:00:11 CDT (DefaultQuartzScheduler_Worker-6) INFO [com.variphy.service.cdr.processor.ClusterCdrProcessingManager] Activating 1 Clusters…
Line 225: 2022-05-26 00:00:11 CDT (DefaultQuartzScheduler_Worker-6) DEBUG [com.variphy.cisco.cdr.processor.file.CDRFileService] CDRFileService.setup: cdrSettings.rootDirectory: /opt/variphy/apps/insight/CDR
Line 226: 2022-05-26 00:00:11 CDT (DefaultQuartzScheduler_Worker-6) ERROR [com.variphy.service.cdr.processor.ClusterCdrProcessingManager] java.nio.file.InvalidPathException: Trailing char < > at index 0: /opt/variphy/apps/insight/CDR
Here are a few different ways you can search the logs:
- You can open the log in the Variphy software. Use Ctrl-F to search for the specific error message or simply search for “ERROR” to search the log for all error messages.
- Copy and paste the text into a text editor like Notepad ++ and search for “ERROR”.
- Download the logs using the Download All Logs button, unzip the logs and open the files in a text editor and search for the error.
Error messages can consist of a single line, or many, many lines